The purpose of a baseline is not to find fault, load, or to take corrective action. A baseline simply
determines what is. You must know what is so that you can test against that when you make a change to
be able to objectively say there was or wasn’t an improvement. You must know where you are at to be
able to properly plan where you are going. A poor baseline assessment, because of inflated numbers or
inaccurate testing, does a disservice to the rest of your project. You must accurately draw the first line
and understand your system’s performance.
Your manager has come to you with another emergency. He has a meeting next week to discuss capacity planning and usage of the system with IT upper management. He doesn’t want to lose his budget, but he has to prove that the system utilization warrants spending more.
What information can you show your manager from your systems?
You could present your manager with a progressive trend graph showing time on the x-axis and several fields on the y-axis that represent changes from a baseline, assuming the necessary data has been collected. With this information, it would be possible to predict when various system resources will reach their maximum capacity.
What type of data would prove system utilization? (Remember the big 4: compute, memory, disk, networking)
CPU load, process execution time, throughput.
Disk Operations (IOPS).
Networking Requests and Bandwidth.
RAM utilization, memory paging/swapping rates.
Current and projected system utilization. By examining trends over time, we can predict when critical resources will reach their limits if no additional capacity is provisioned.
Below is a sample progressive trend graph over the last 6 months. The x-axis represents time (in weeks), while the y-axis shows percentage utilization relative to an established baseline.
We can estimate the “time to ceiling” for critical resources. For instance, if CPU load is rising at an average rate of 2–3% per month, and we know that at 90% utilization the system will experience performance degradation.
Projected Time to CPU Ceiling: 3–5 months Projected Time to Memory Ceiling: 6–8 months Projected Time to Disk IOPS Ceiling: 8–10 months Projected Time to Network Bandwidth Ceiling: 4–6 months
Investment in scaling resources now will prevent future performance bottlenecks, ensuring the system can continue to meet business demands effectively.
You are in a capacity planning meeting with a few of the architects. They have decided to add 2 more agents to your Linux Sytems, Bacula Agent and an Avamar Agent . They expect these agents to run their work starting at 0400 every morning.
What do these agents do? (May have to look them up)
Bacula is an open-source suite of tools designed to automate backup tasks. It’s widely regarded for its flexibility and reliability. Dell Avamar, on the other hand, is a commercial backup automation solution. Both tools handle incremental backups using custom daemons that monitor changes over time, offering greater sophistication than simple scheduling systems like Cron. Additionally, they can manage backups across diverse, heterogeneous storage environments.
Do you think there is a good reason not to use these agents at this timeframe?
This approach is about balancing workload. If all processes start at a fixed time, they can consume valuable resources simultaneously. The best schedule depends on the environment. For example, if the environment experiences downtime—such as a traditional office setting—starting backups at 4 a.m. might be fine. However, if services run around the clock, it’s better to stagger the tasks so they use only a fraction of the available resources at any given time. This approach also reduces the impact of failures, since not all systems are involved at once.
Is there anything else you might want to point out to these architects about these agents they are installing?
There are several factors architects should consider. However, in the context of this discussion, performance overhead is particularly relevant. They need to ensure that the chosen backup solutions won’t overburden the system’s resources and that there’s enough “breathing room” to maintain smooth operations.
Your team has recently tested at proof of concept of a new storage system. The vendor has published the blazing fast speeds that are capable of being run through this storage system. You have a set of systems connected to both the old storage system and the new storage system.
Write up a test procedure of how you may test these two systems.
I did a bit of research regarding tooling for such a task and found FIO ‘Flexible Input / Output’, a program written for the purpose of testing systems with various scenarios.
Rather than using BASH, I can run more comprehensive testing with more data to analyze using FIO.
I would then pipe the output of these commands to AWK to seperate out specific datapoints to append to files for full analysis.
How are you assuring these test are objective?
By gathering multiple datasets with varying run parameters, I can reduce statistical noise and better isolate data of interest by comparing these datasets against one another.
What is meant by the term Ceteris Paribus, in this context?
in the context of system benchmarking means that when measuring the performance of one specific aspect of the system, all other variables and conditions are kept constant. This approach ensures that any observed changes in performance can be attributed directly to the variable under test, rather than being influenced by unrelated fluctuations in the environment or system load.
Analyzing data may open up a new field of interest to you. Go through some of the
free lessons on Kaggle, here: https://www.kaggle.com/learn
a. What did you learn?
b. How will you apply these lessons to data and monitoring you have already
collected as a system administrator?
Find a blog or article that discusses the 4 types of data analytics.
a. What did you learn about past operations?
b. What did you learn about predictive operations?
Download Spyder IDE (Open source)
a. Find a blog post or otherwise try to evaluate some data.
b. Perform some Linear regression. My block of code (but this requires some
additional libraries to be added. I can help with that if you need it.)
Create config file
sudo vim /etc/grafana/grafana.ini
Change the default value of:
The option ‘http_addr’ to ’localhost’, the ‘http_port’ to ‘3000’, and the ‘domain’ option to your domain name as below. For this example, the domain name is ‘grafana.example.io’.
For non-standard port, be sure to uncomment ;
[server] 👍
http_port = 4000 👍
The public facing domain name used to access grafana from a browser
domain = grafana.example.io
7.1 Turn off the nasty default report of analytics 👺
[analytics]
reporting_enabled = false
7.2. Restart the grafana service to apply a new configuration.
sudo systemctl restart grafana-server
Reverse Proxy Setup
Install NGINX
sudo dnf install nginx -y
Create a new server block for grafana
/etc/nginx/conf.d/grafana.conf
Required to proxy Grafana Live WebSocket connections
Note:
All Prometheus configuration at the ‘/etc/prometheus’ directory, and all Prometheus data will automatically be saved to the directory ‘/var/lib/prometheus’.
Installing Prometheus on Rocky Linux
Install Prometheus monitoring system manually from the tarball or tar.gz file.
Change the working directory
to ‘/usr/src’ and download the Prometheus binary
On the ‘scrape_configs’ option, you may need to add monitoring jobs
The default configuration comes with the default monitoring job name ‘prometheus’ and the target server ’localhost’ through the ‘static_configs’ option.
Change the target from ’localhost:9090’ to the server IP address ‘192.168.1.10:9090’ as below.
Note:
Scrape configuration containing exactly one endpoint to scrape:
Here it’s Prometheus itself.
scrape_configs:
The job name is added as a label job=<job_name> to any timeseries scraped from this config.
job_name: “prometheus”
metrics_path defaults to ‘/metrics’
scheme defaults to ‘http’.
static_configs:
targets: [“192.168.1.10:9090”]
Change the configuration and data directories to the user ‘promethues’.
In this unit, we explore monitoring systems, which often consist of multiple interconnected components. At its core, monitoring involves carefully exposing system data and transmitting it to tools for analysis and alerting. From my experience with Prometheus and Grafana—two widely used and versatile solutions—I’ve seen how effective these tools can be for various scenarios. However, many other tools are also available. One of my key takeaways from the unit’s readings and labs was the importance of careful data exposure. Much like setting permissions in a Linux system, it’s crucial to determine what data can be accessed and who is allowed to see it in the reporting chain. System information, if mishandled, can easily become a double-edged sword.
You’ve heard the term “loose coupling” thrown around the
office about a new monitoring solution coming down the pike. You find a good resource and
read the section on “Prefer Loose Coupling” https://sre.google/workbook/monitoring/
Loose coupling means the components of a system can operate independently, yet still work together when combined. This design allows individual components to be swapped or replaced with minimal disruption to the overall system. In contrast, a strongly coupled system binds its components so tightly that altering one would disrupt or even break the entire system’s functionality.
The advantage of a loosely coupled monitoring system lies in its flexibility to evolve over time. Systems change, requirements shift, and new tools emerge, making adaptability essential. A design that allows components to be replaced or upgraded with minimal disruption is highly valuable—not only for an organization aiming to maintain efficiency but also for the administrators and engineers responsible for ensuring stability and resolving issues.
Exposing metrics involves making system information accessible for monitoring and analysis. However, this must be approached with caution, as exposing such information can introduce vulnerabilities. Simply exposing data without actively collecting or utilizing it needlessly increases security risks without providing any benefit.
Your HPC team is asking for more information about how CPU 0
is behaving on a set of servers. Your team has node exporter writing data out to Prometheus
(Use this to simulate https://promlabs.com/promql-cheat-sheet/).
cd /usr/src
wget https://github.com/prometheus/prometheus/releases/download/v3.0.1/prometheus-3.0.1.linux-amd64.tar.gz
tar -xzf prometheus-3.0.1.linux-amd64.tar.gz
cd prometheus-3.0.1.linux-amd64
This week, we were privileged to host a special guest lecture by John Champine, Scott’s brother. Over the course of an engaging two-hour session, John delivered an in-depth exploration of Kubernetes, thoroughly covering the five W’s: Who, What, When, Where, and Why.
John’s passion and deep knowledge of Kubernetes were evident throughout the presentation. Having firsthand experience with the challenges of pre-Kubernetes infrastructure, he offered valuable insights into how this platform has revolutionized modern computing. Notably, John specializes in OpenShift, an IBM-owned management layer built atop Kubernetes. OpenShift adds additional functionality and ease of use to what is already a powerful but complex system.
One concept that particularly caught my attention was the fractionalization of CPU and memory resources made possible by Kubernetes’ sophisticated resource management. John introduced the term millicore, a concept I was previously unfamiliar with. It refers to the fine-grained allocation of processing power, where fractions of a CPU core are shared across processes during compute cycles. This ability to manage resources at such a granular level is remarkable, showcasing the efficiency and precision of Kubernetes.
Before this lecture, I never imagined that such details—down to the microsecond allocation of core usage—could not only be considered but also controlled and utilized to optimize workloads. This level of resource management truly solidifies Kubernetes’ position as the “operating system of the internet,” enabling applications to run more efficiently and reliably across diverse infrastructures.
John’s insights not only deepened my understanding of Kubernetes but also sparked curiosity about the broader implications of containerized resource management in modern computing.
One idea that has been dispelled by doing these exercises is that Kubernetes is overkill for most things. Yes, standing up multiple networked nodes and having them interoperate is no small task. However, there exist lightweight, single node variants like K3s that enable a simplified experience while maintaining the powerful advantages of an orchestration system.
When the article says Kubernetes is not a PaaS, what do they mean by that? What is a PaaS in comparison?
Kubernetes is not a Platform-as-a-Service (PaaS) because it operates at the container level rather than the application or hardware level. While it provides some features similar to PaaS offerings, Kubernetes emphasizes flexibility, composability, and user choice rather than prescribing a monolithic solution.
You get a ticket about your new test cluster. The team is unable to deploy some of their applications. They suspect there is a problem and send you over this output:
What are you checking on the cluster to validate you see their error?
To identify and validate the issue with the node Test_Cluster2:
Check the overall cluster status
Run kubectl get nodes to see the status of all nodes in the cluster.
This confirms Test_Cluster2 is NotReady.
Inspect node details
Run kubectl describe nodes Test_Cluster2 to check for events, taints, and resource usage issues. Look for errors related to kubelet, network, or node conditions.
Access the node**
SSH into the node with ssh Test_Cluster2 to perform further diagnostics.
Verify kubelet status
Run systemctl status kubelet to check if the kubelet service is running and healthy.
Check container runtime
Depending on your runtime, run either systemctl status docker or systemctl status podman to ensure the container runtime is operational.
Reload and restart services
If issues are detected, attempt to reload the systemd daemon (systemctl daemon-reload) and restart kubelet (systemctl restart kubelet).
Potential problems for Test_Cluster2 being NotReady include:
The Test_Cluster2 node is running Kubernetes version v1.29.6+k3s1, which is older than the server and other nodes (v1.30.6+k3s1). This may cause compatibility issues.
The kubelet service might have failed or not started.
Networking problems could prevent the node from communicating with the control plane.
The node may lack sufficient CPU, memory, or disk space for the kubelet to function.
Taints, labels, or configuration errors might prevent the node from becoming Ready.
Hardware issues or kernel module problems may impact the node’s health.
You are the network operations center (NOC) lead. Your team has recently started supporting the dev, test, and QA environments for your company’s K8s cluster. Write up a basic checkout procedure for your new NOC personnel to verify operation of the cluster before escalating on critical alerts.
I do have prior experience with this having completed the DevSecOps certification from TryHackMe, it covers containers security with red-team exercises.
However, it does not cover a ton of defensive measures. This best practices document is going to be really helpful when setting up future containers.
Do this to practice securing those containers. https://killercoda.com/killer-
shell-cks/scenario/static-manual-analysis-docker 👍
Do some of your same checks from before. What do you notice about the pods you created? Did they all
work?
If this breaks in the lab, document the error. Check your disk space and RAM, the two tightest
constraints in the lab. Using systemctl restart k3s and journalctl -xe can you figure out what is failing?
(Rocky boxes may have limitations that cause this to not fully deploy, can you find out why?)
I would like to know more about Kubernetes and how it can be effectively managed, but this is just a matter of further study.
How can you apply this now in your current role in IT? If you’re not in IT, how can you
look to put something like this into your resume or portfolio?
I installed K3S on my personal lab and ran through two days of exercises with the study group, gaining some competency with installing, configuring and deploying a set of pods from manifests. So I could confidently state that I know how to do this and check on the health of the system.
One of the most exciting units for me has been exploring deployment and hosting infrastructure. I’ve already spent some time working with Docker and Podman, but I have had limited hands-on experience with Kubernetes. Before this unit, I completed a few interactive Kubernetes labs on Killercoda, covering basic commands, information gathering, and logging.
This week, I followed an interactive K3s lab that guided me through the installation process—a perfect refresher. Afterward, I jumped onto one of my Proxmox VMs and installed K3s on my homeLab 👨🔧
It’s a slow day in the NOC and you have heard that a new system of container deployments are being used by your developers. Do some reading about containers, docker, and podman.
I did not know that Podman and Kubernetes can run WASM Applications alongside containers. I have some interest in WASM and Subsequent ByteCode, having read about it on occasion.
I did not know that Podman containers can be converted to SystemD services.
I learned a technique that I quite like using podman commit to create a custom compose file from a modified container and will likely use this alot.
Terminology that I wasn’t familiar with:
Control Plane: Manages container orchestration, monitoring, and state across cluster nodes.
The API server: Core interface for communication between users and container clusters.
Scheduler: Assigns containers to nodes based on resource availability and policies.
Can be declarative with compose. So infrastructure can be explicitly defined and easily rebuilt.
Light weight / low resource. Containers are not complete systems and are stripped to the bare essentials, meaning they are very small files that run fast.
You get your first ticket about a problem with containers. One of the engineers is trying to move his container up to the Dev environment shared server. He sends you over this information about the command he’s trying to run.
[developer1@devserver read]$ podman ps
CONTAINER ID  IMAGE       COMMAND     CREATED     STATUS      PORTS       NAMES

[developer1@devserver read]$ podman images

REPOSITORY                TAG                IMAGE ID      CREATED      SIZE
localhost/read_docker     latest             2c0728a1f483  5 days ago   68.2 MB
docker.io/library/python  3.13.0-alpine3.19  9edd75ff93ac  3 weeks ago  47.5 MB
[developer1@devserver read]$ podman run -dt -p 8080:80/tcp docker.io/library/httpd
You decide to check out the server
[developer1@devserver read] ss -ntulp
Netid   State    Recv-Q   Send-Q      Local Address:Port        Peer Address:Port         Process
udp     UNCONN   0        0           127.0.0.53%lo:53               0.0.0.0:*             users:(("systemd-resolve",pid=166693,fd=13))
tcp     LISTEN   0        80              127.0.0.1:3306             0.0.0.0:*             users:(("mariadbd",pid=234918,fd=20))
tcp     LISTEN   0        128               0.0.0.0:22               0.0.0.0:*             users:(("sshd",pid=166657,fd=3))
tcp     LISTEN   0        4096        127.0.0.53%lo:53               0.0.0.0:*             users:(("systemd-resolve",pid=166693,fd=14))
tcp     LISTEN   0        4096                    *:8080                   *:*             users:(("node_exporter",pid=662,fd=3))
There is a container call node exporter that is listening on port 8080, therefore the port is already in use. I think this is a pretty common issue as this port is normally used for public traffic. With many nodes running it is easy to double assign a port.
It is true that once and image is pulled, it is stored locally. So the developer may have pulled the image. However in the command he is specifying a source for pulling a fresh container, so the dev is definitely sus. Typically if the image has been pulled it is given a container ID, which is then used to build with.
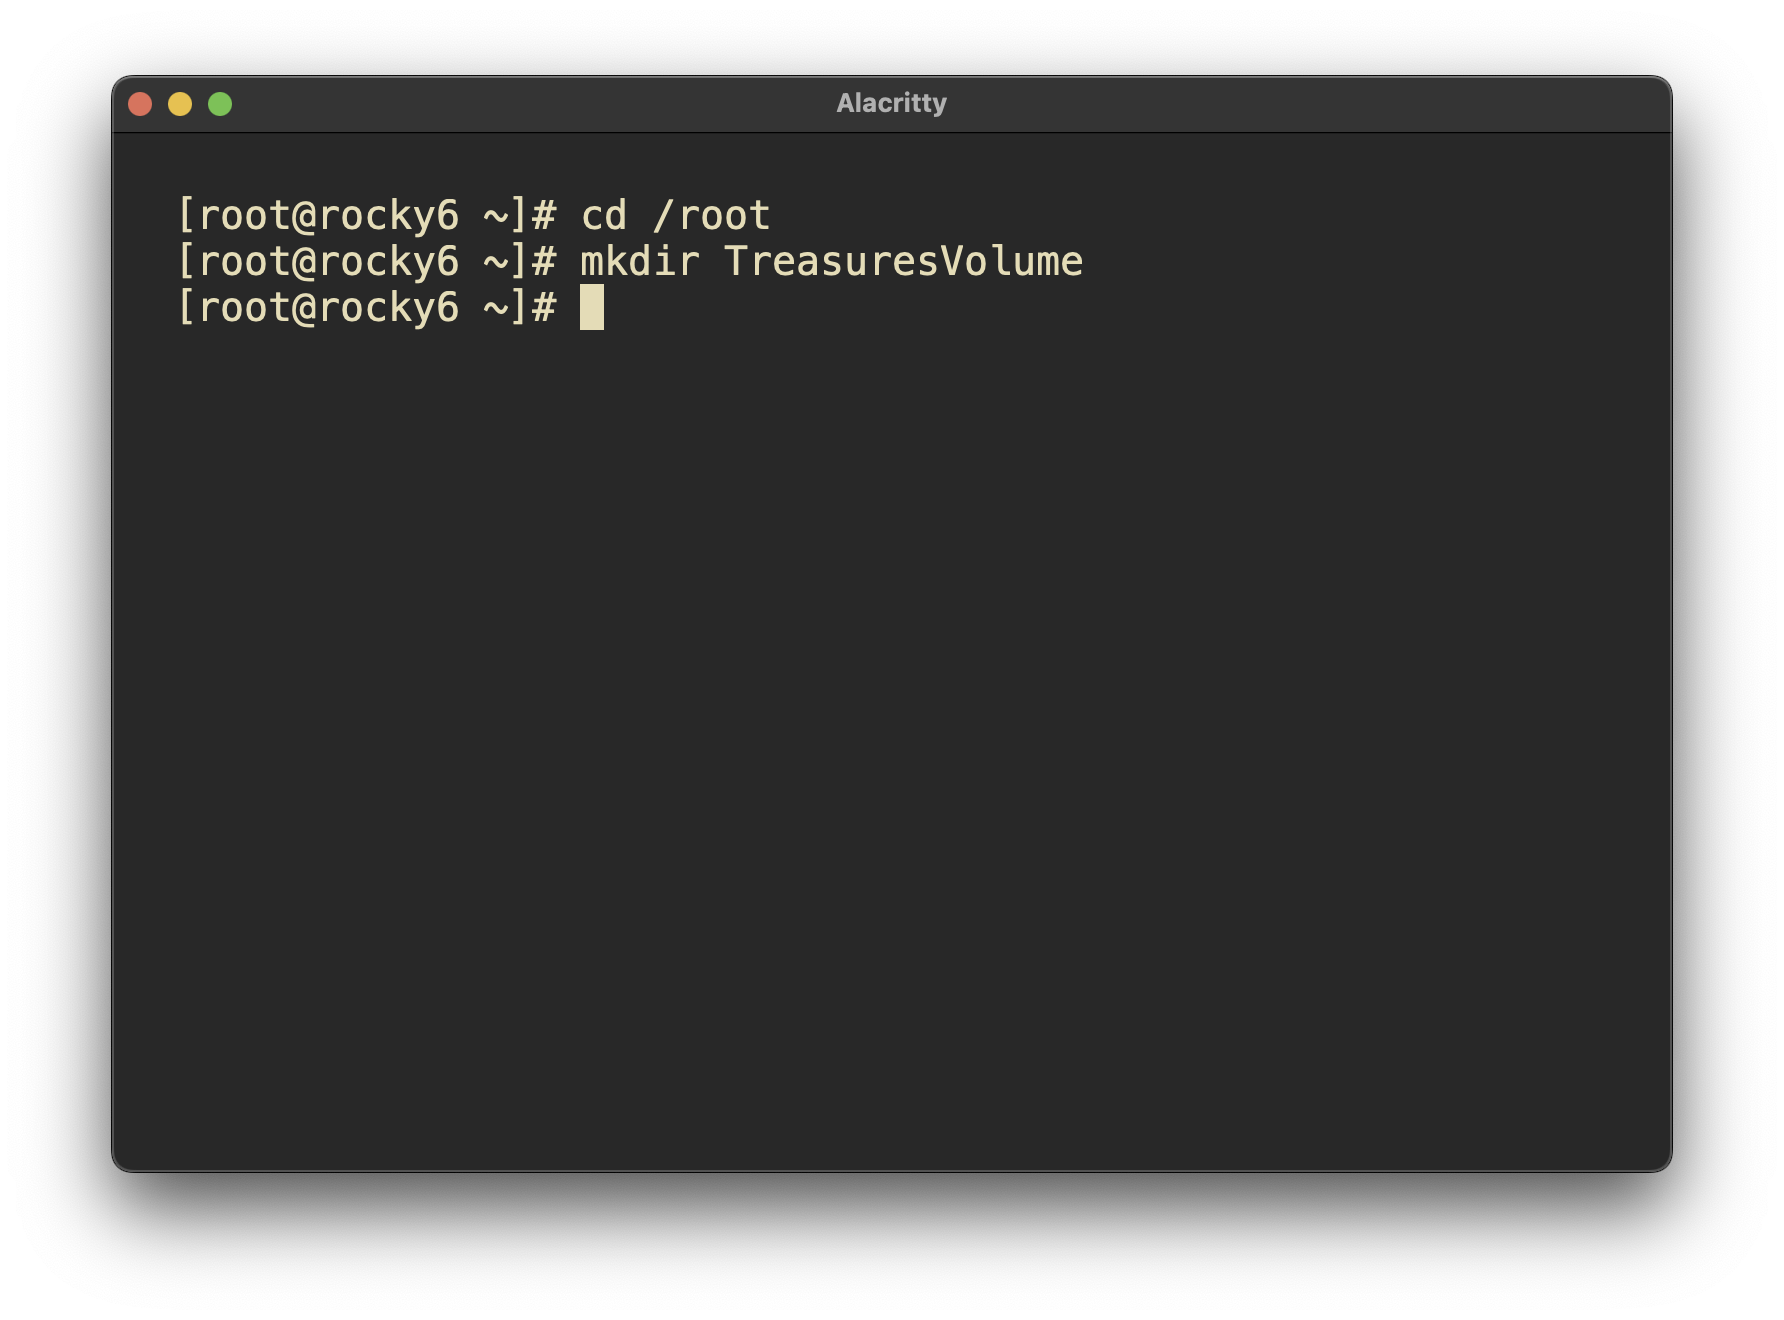
creating a persistent volume and attaching to the volume worked well.
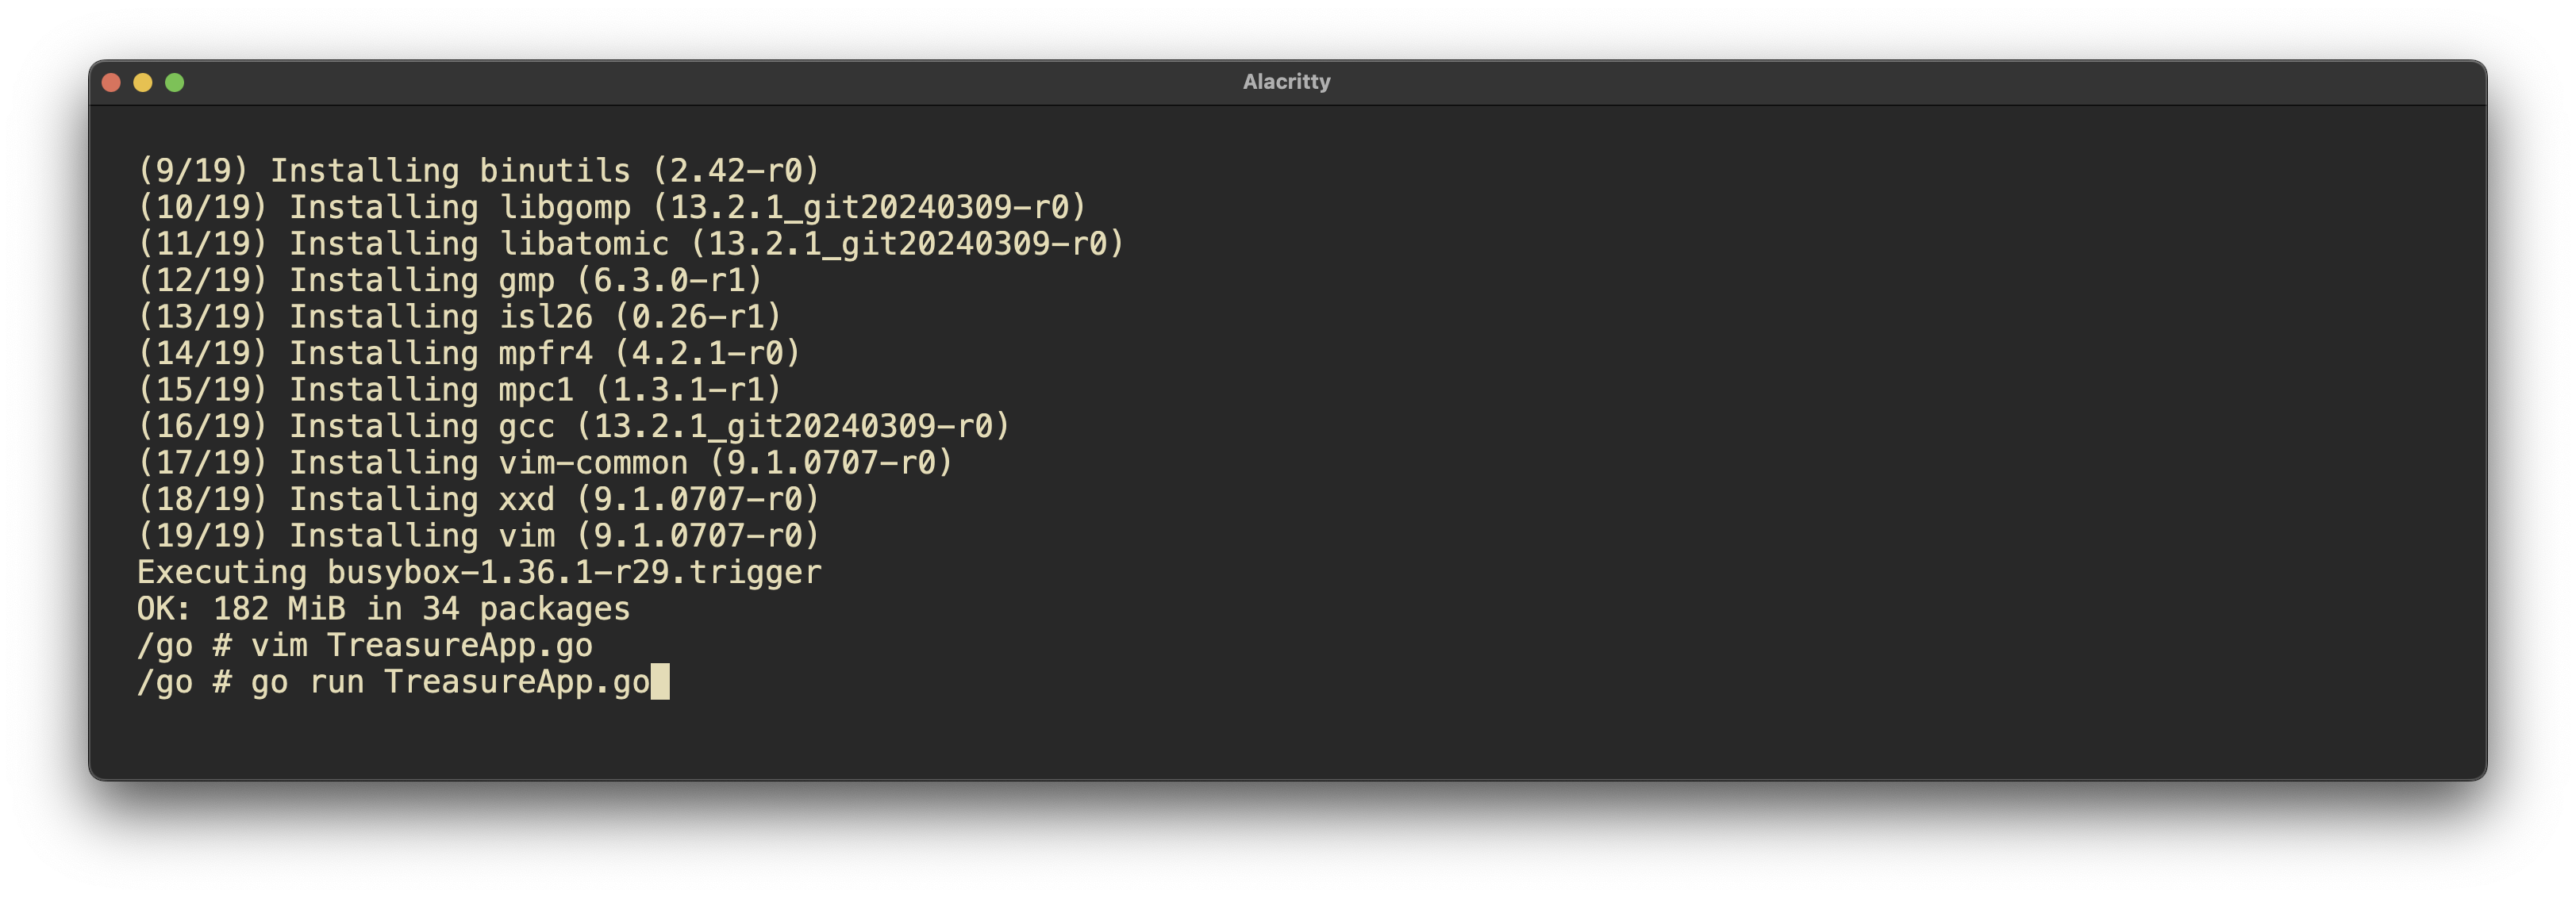
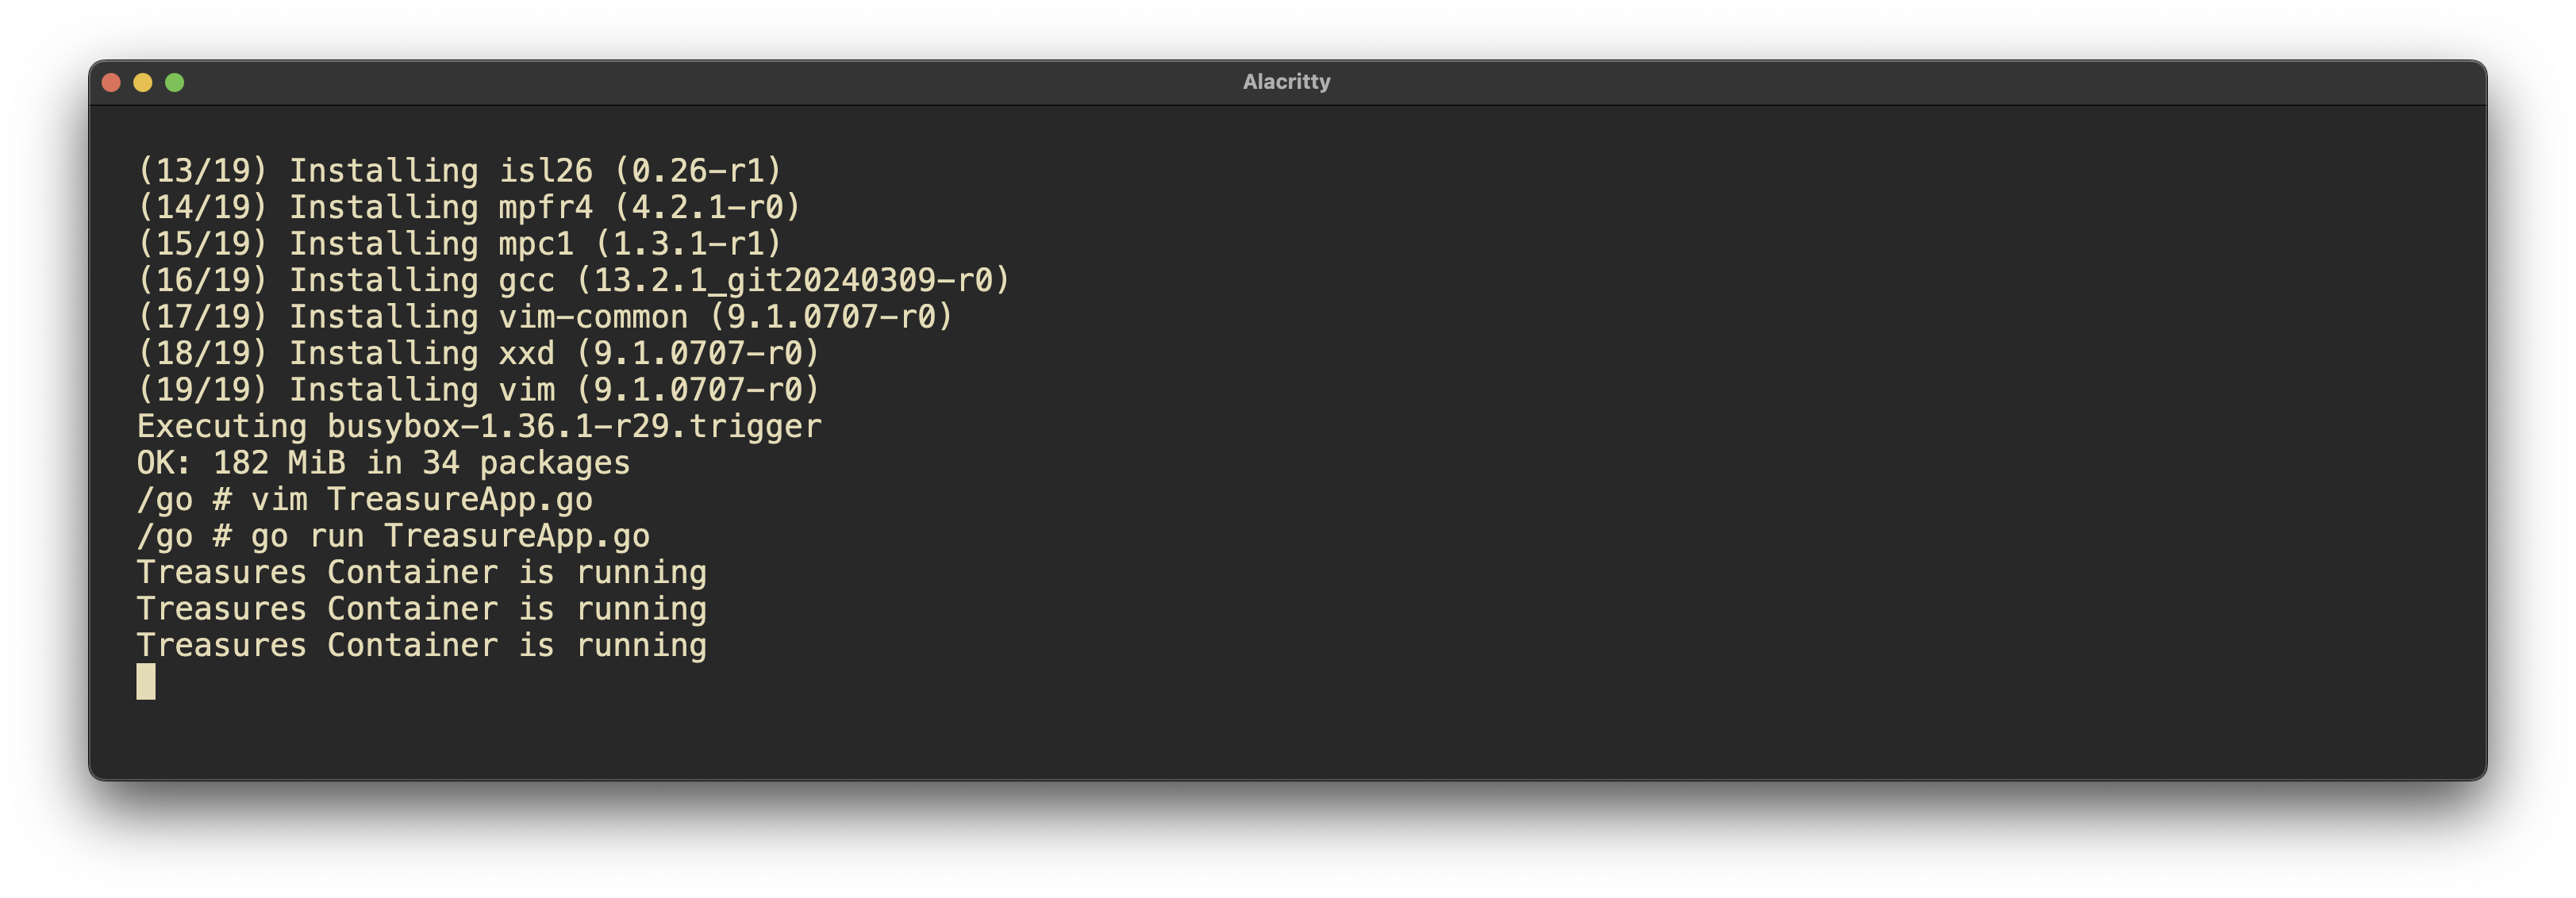
mkdir /root/TreasuresVolume
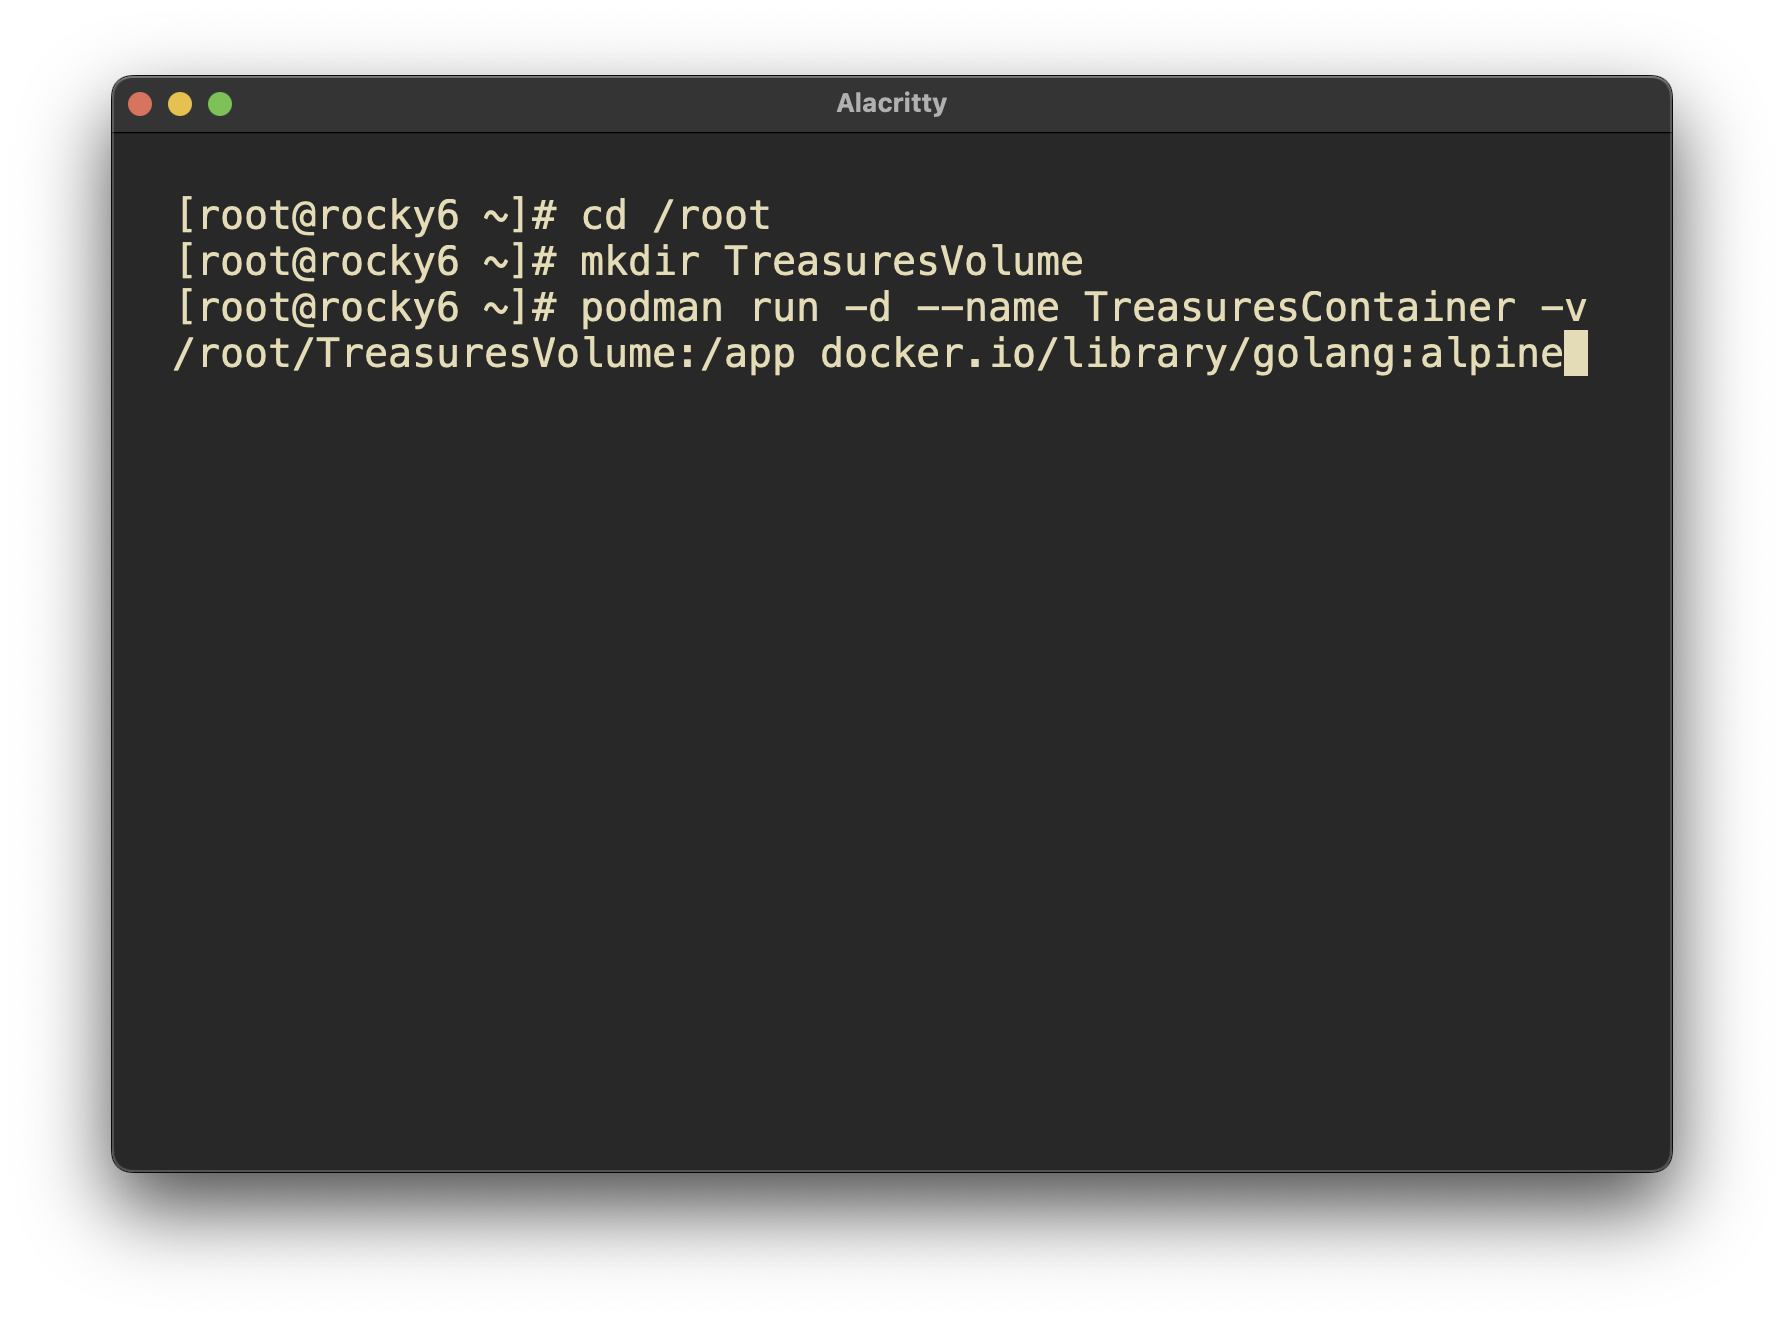
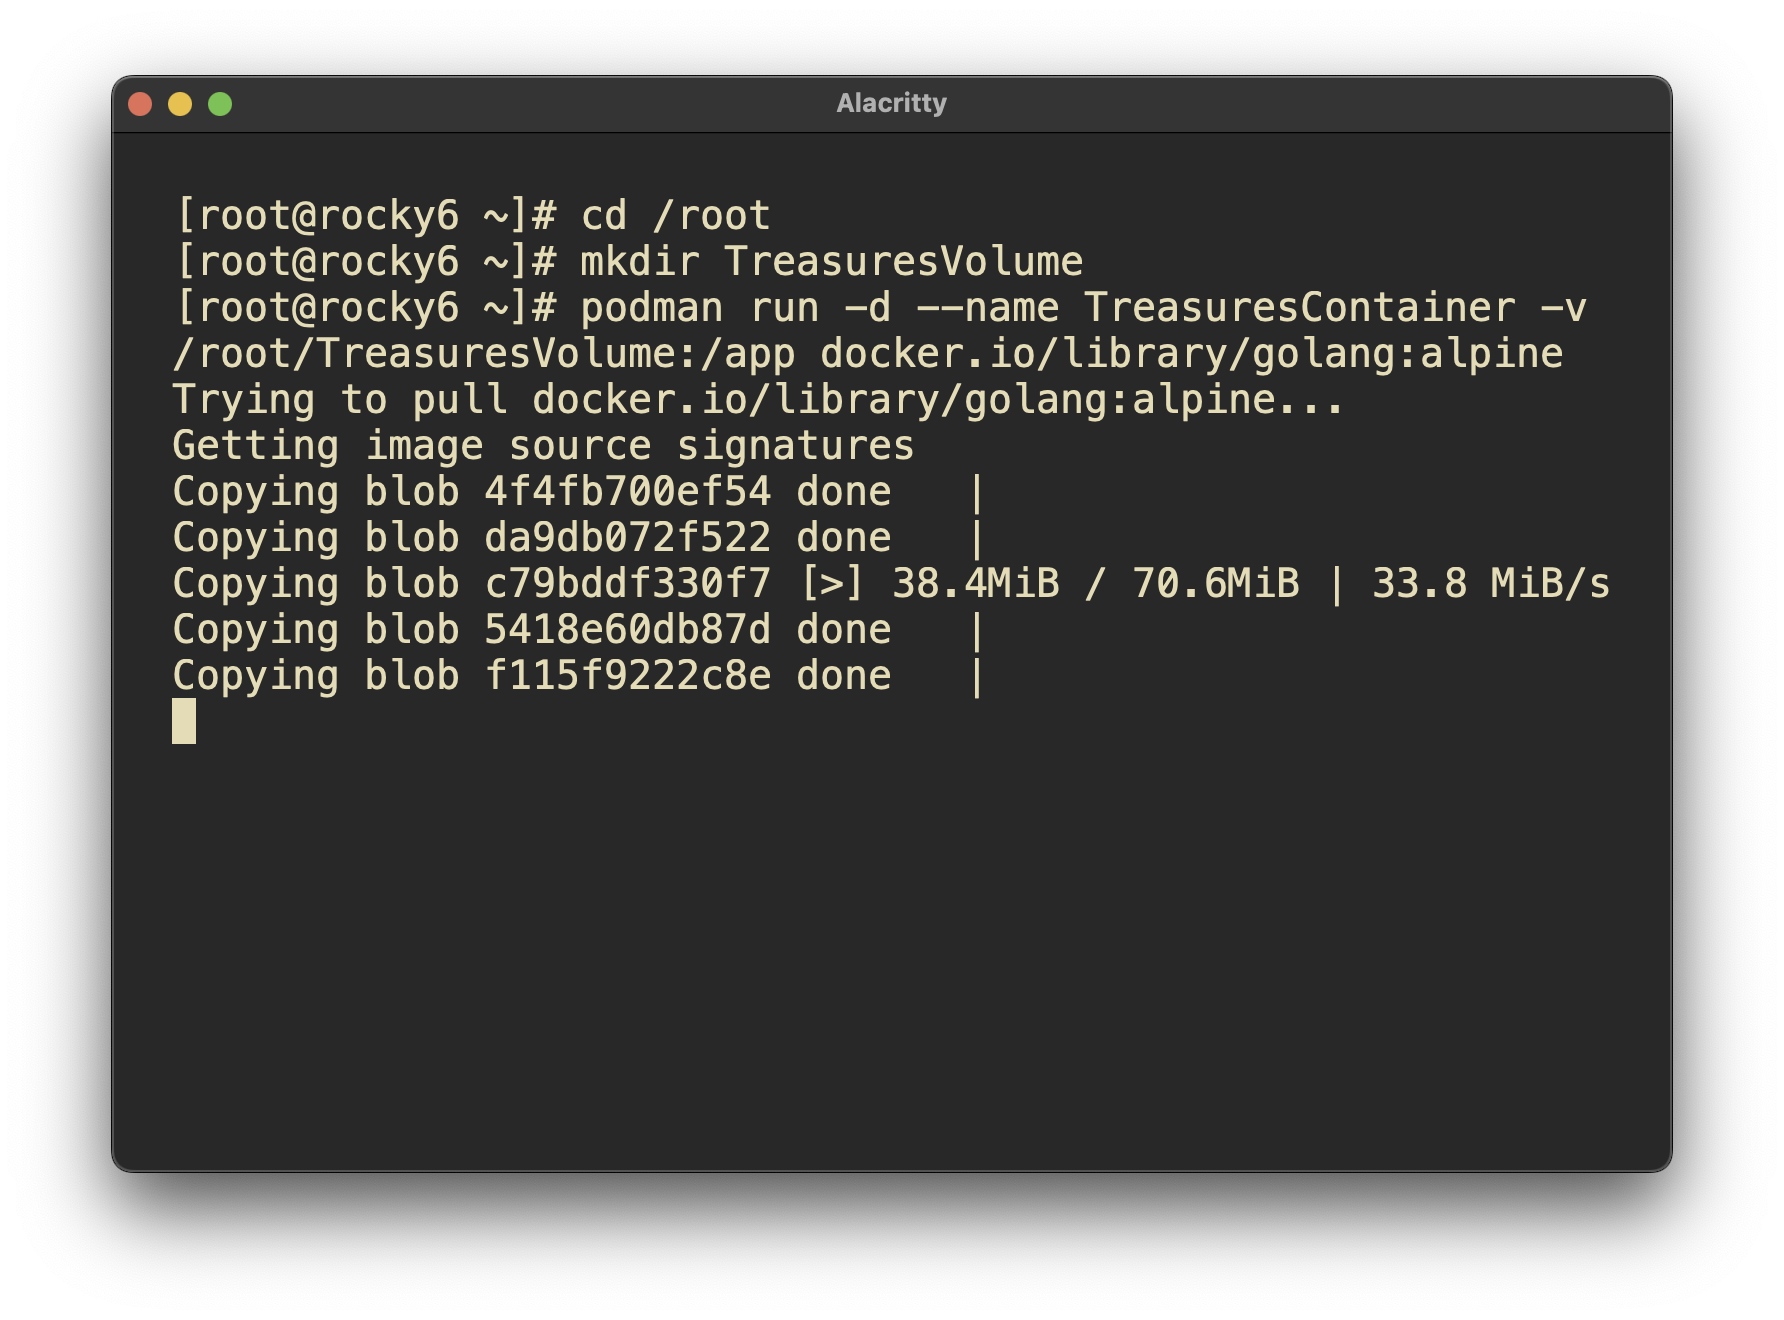
Pulling and building an image worked well.
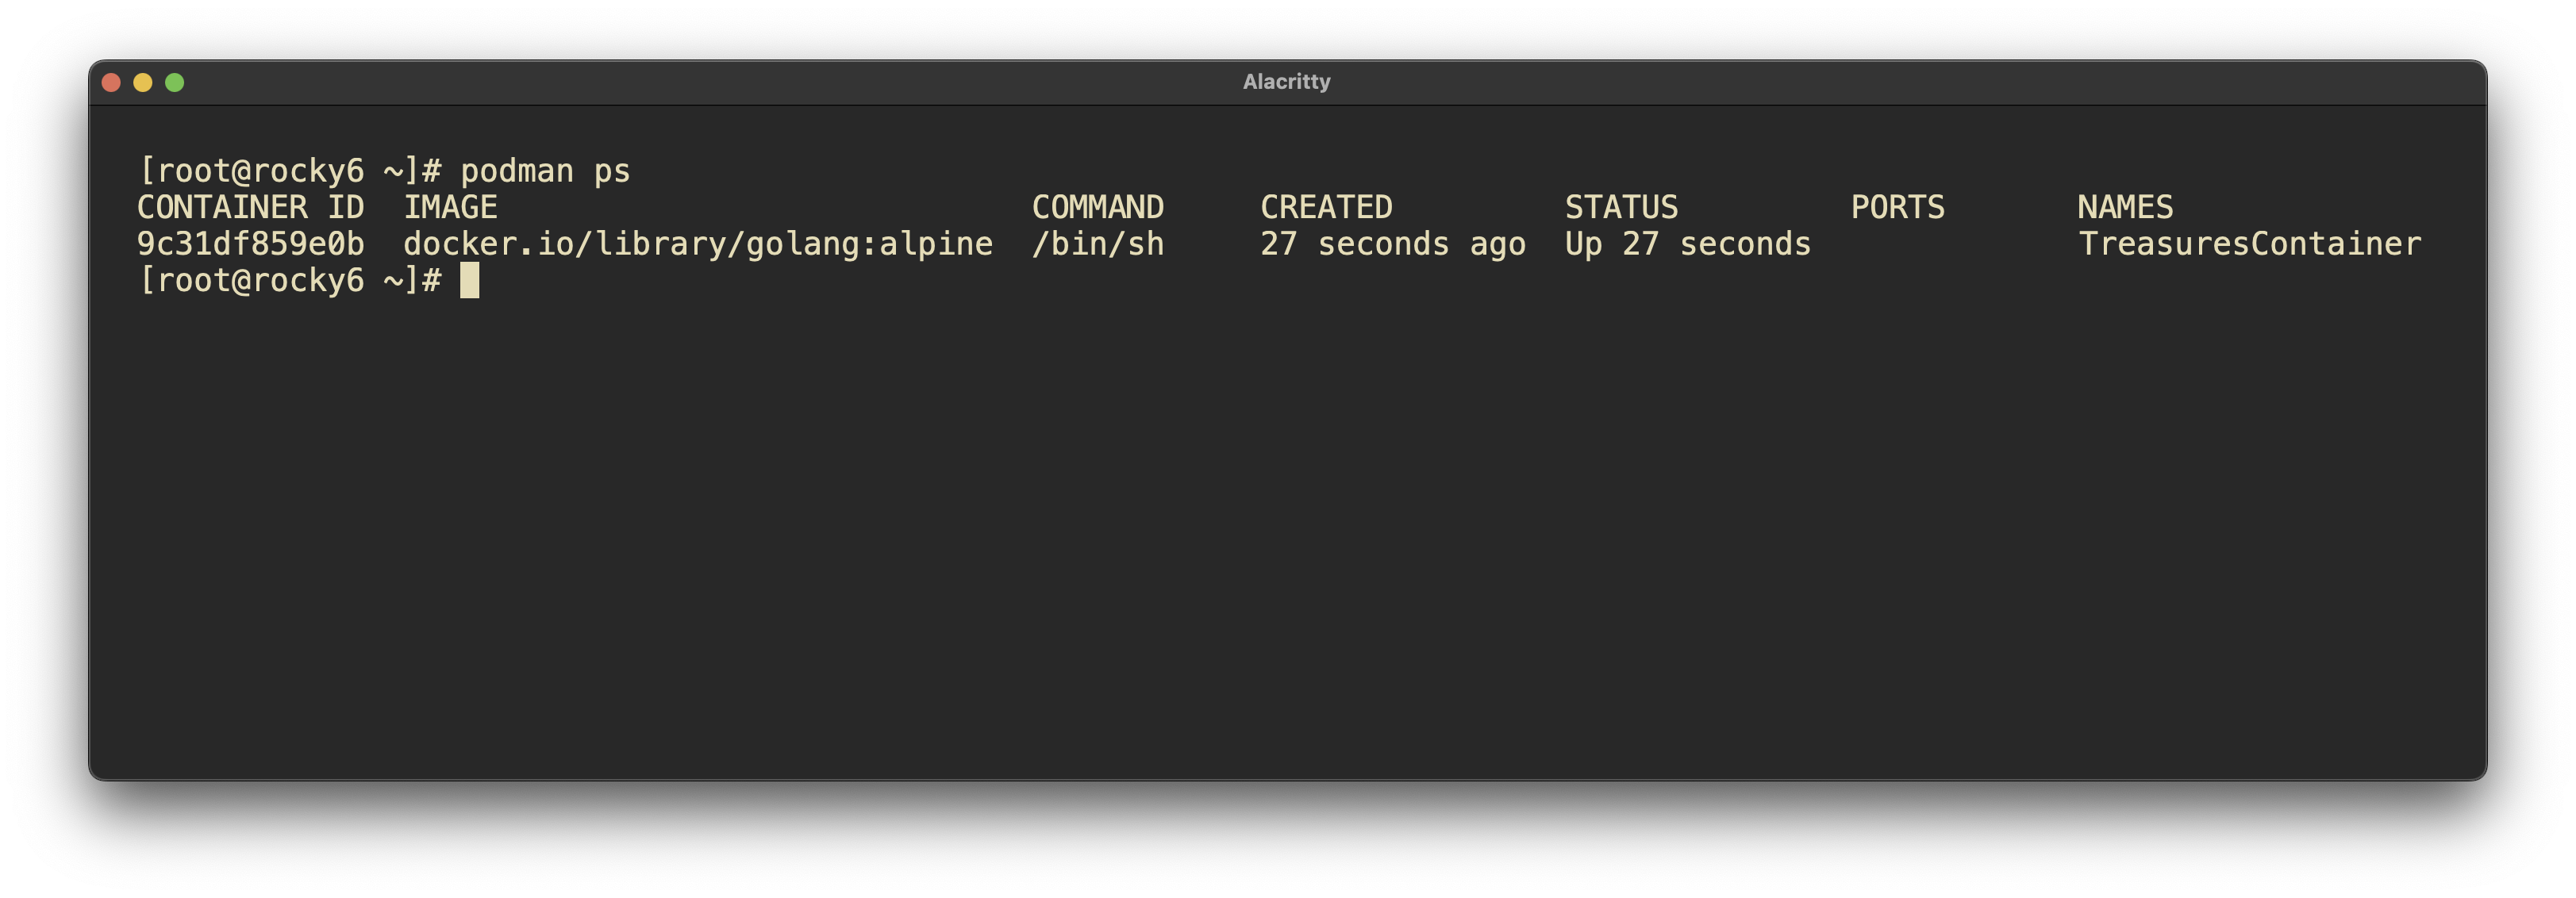
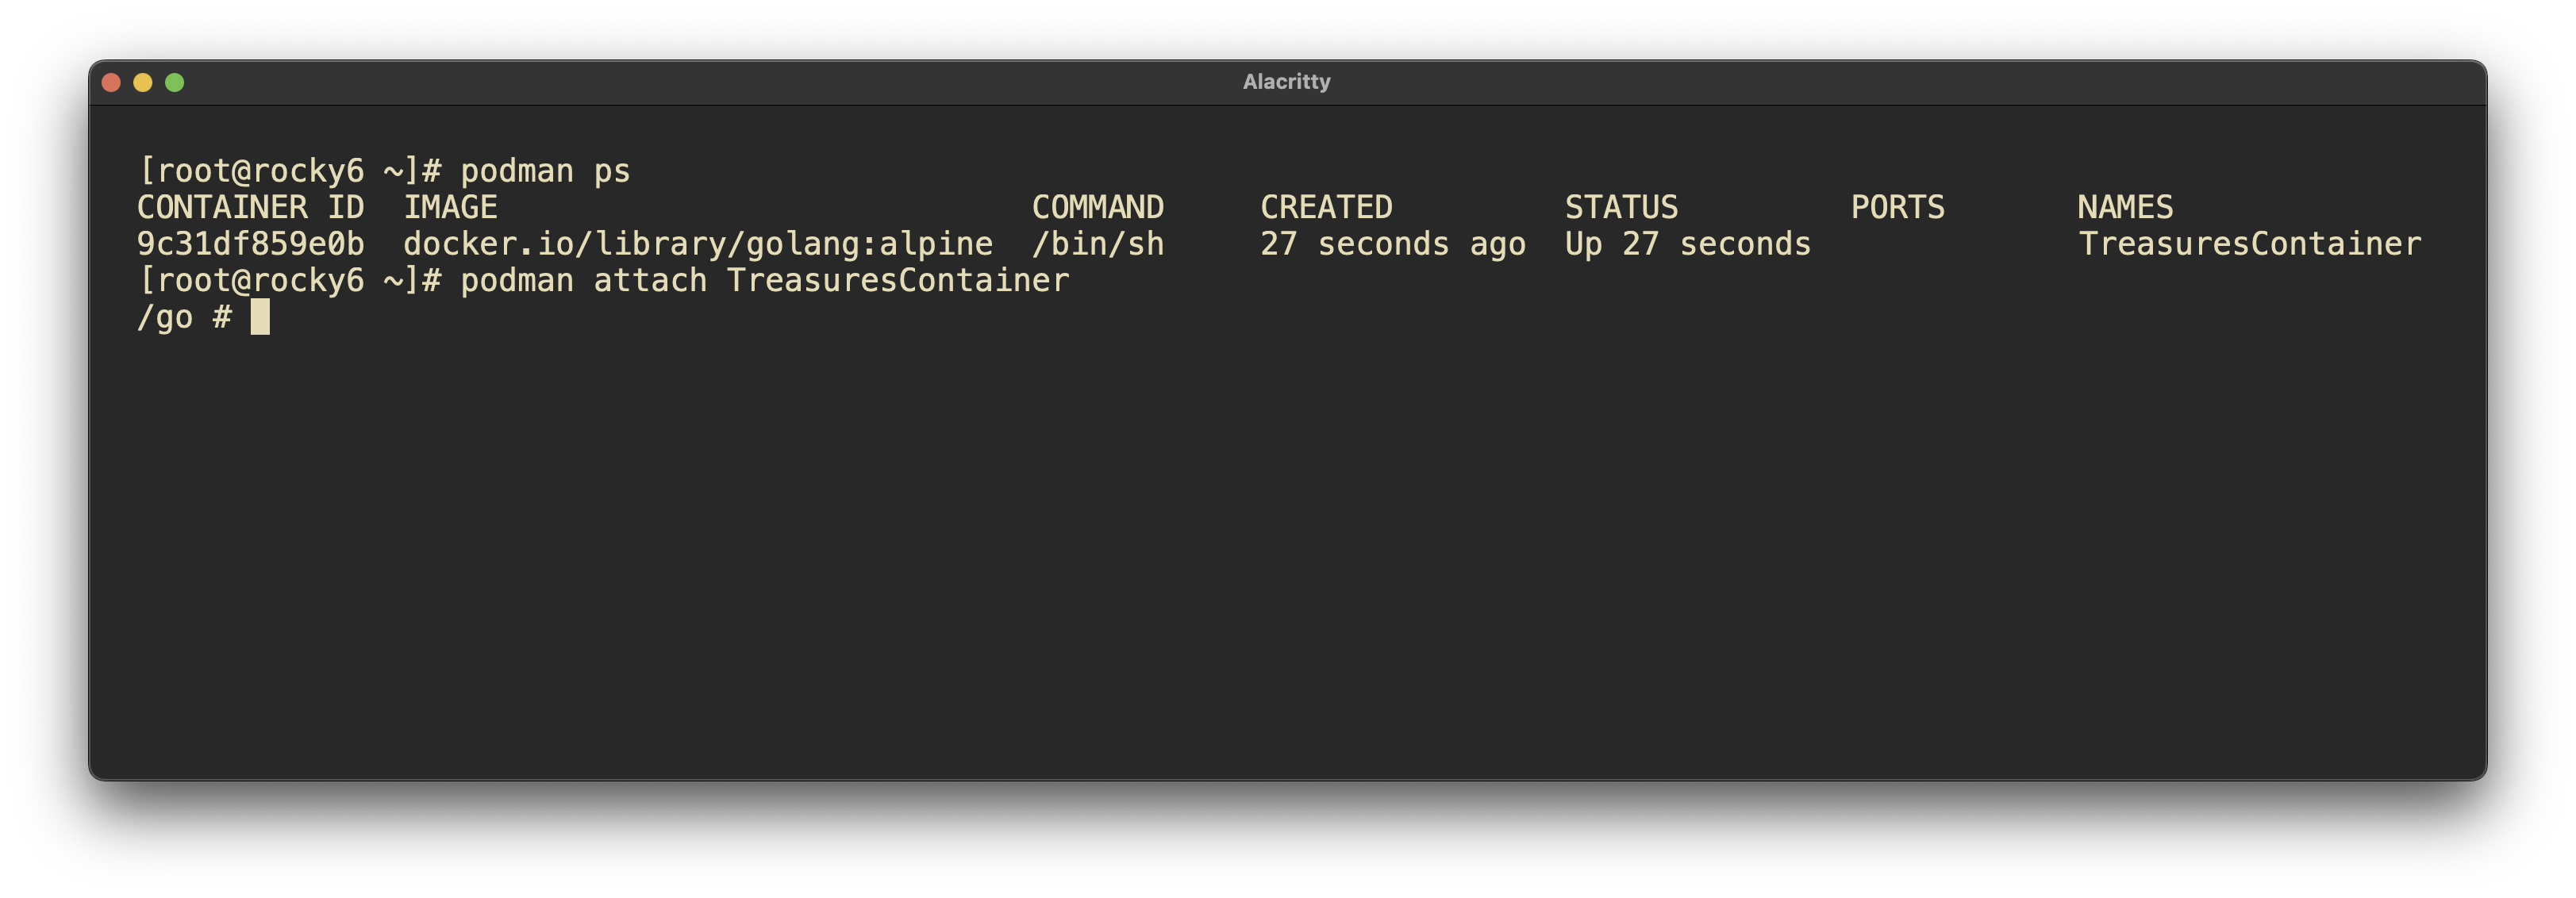
Attaching to the container and interacting with it went well.
podman run -dit –name TreasuresContainer -v /root/TreasuresVolume:/app docker.io/library/golang:alpine tail -f /dev/null
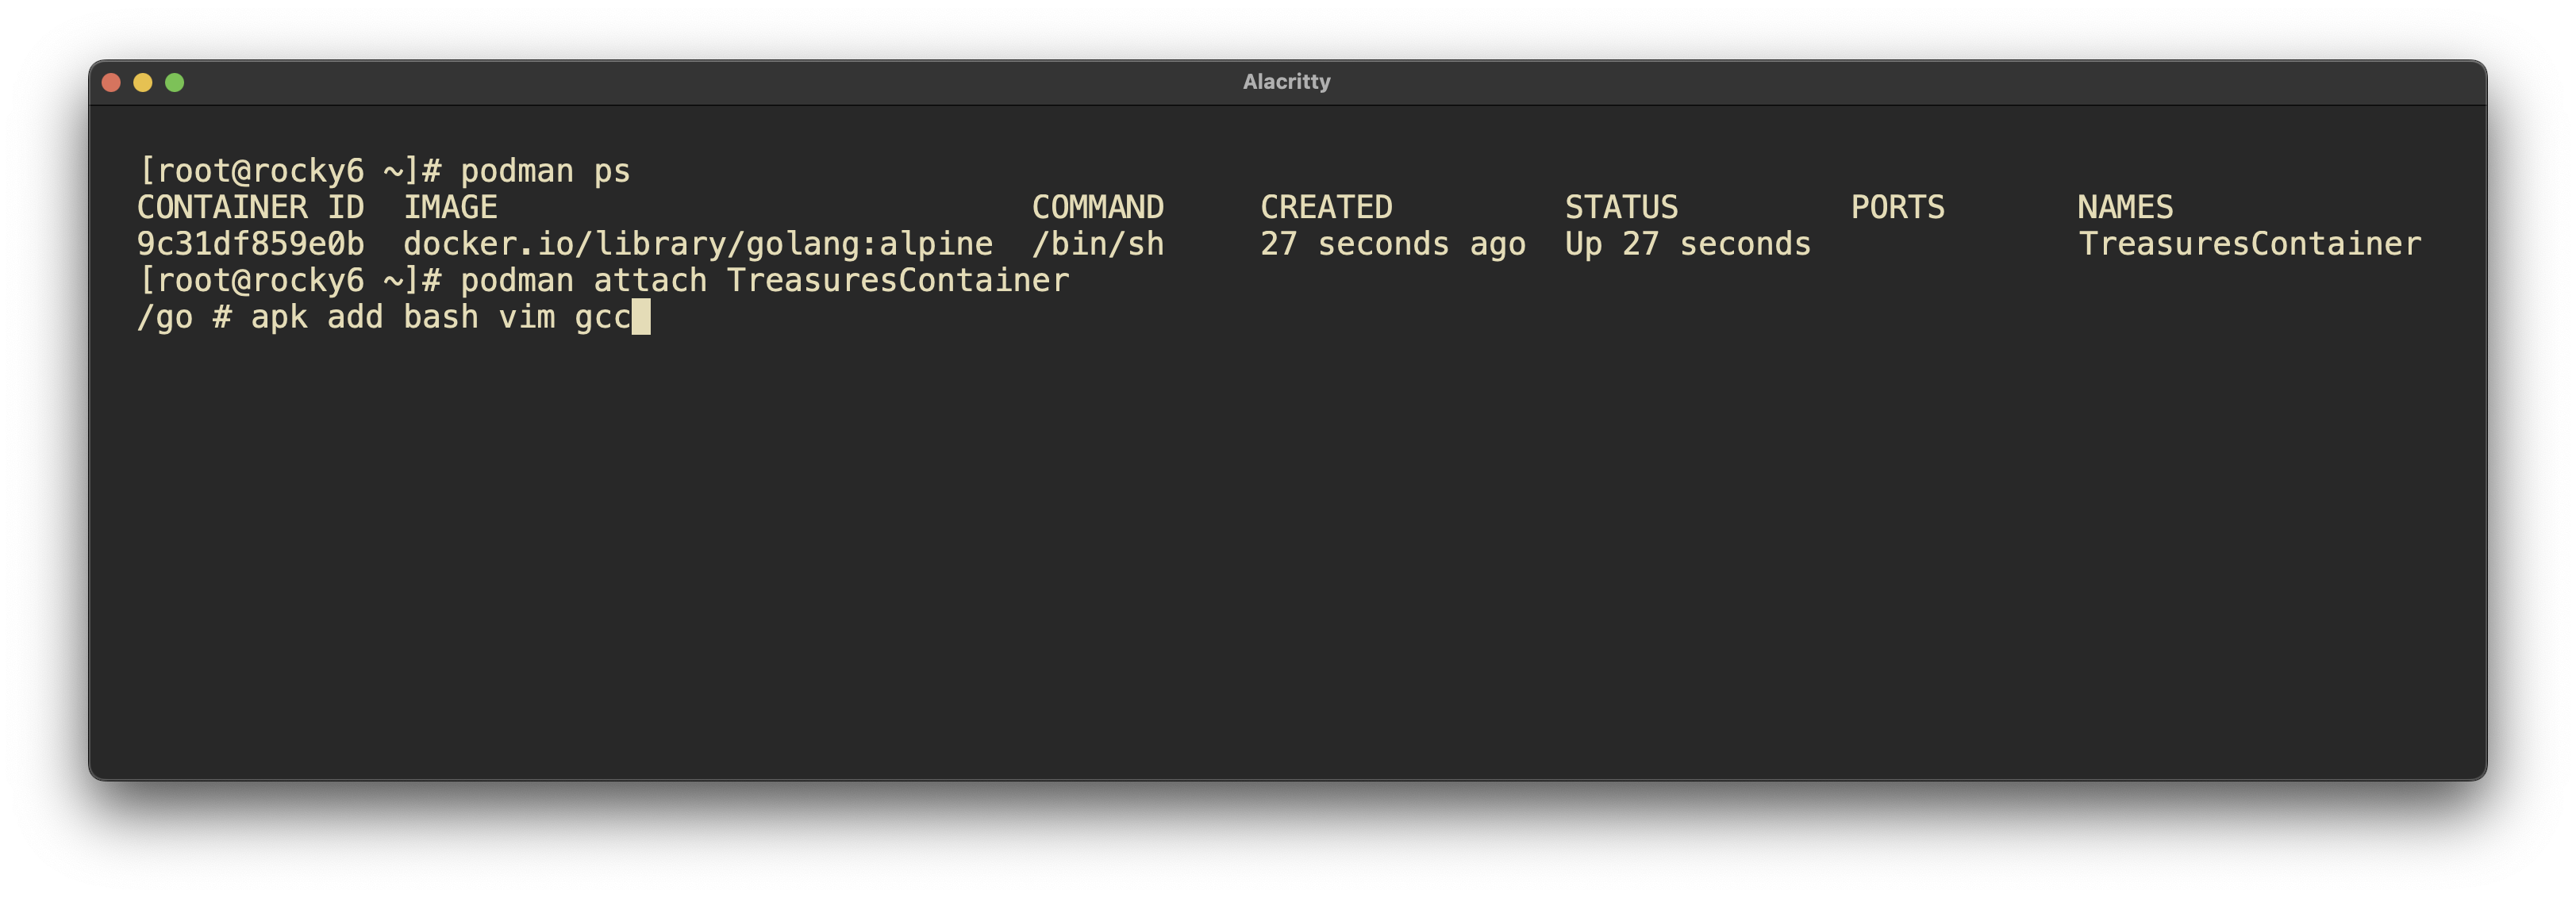
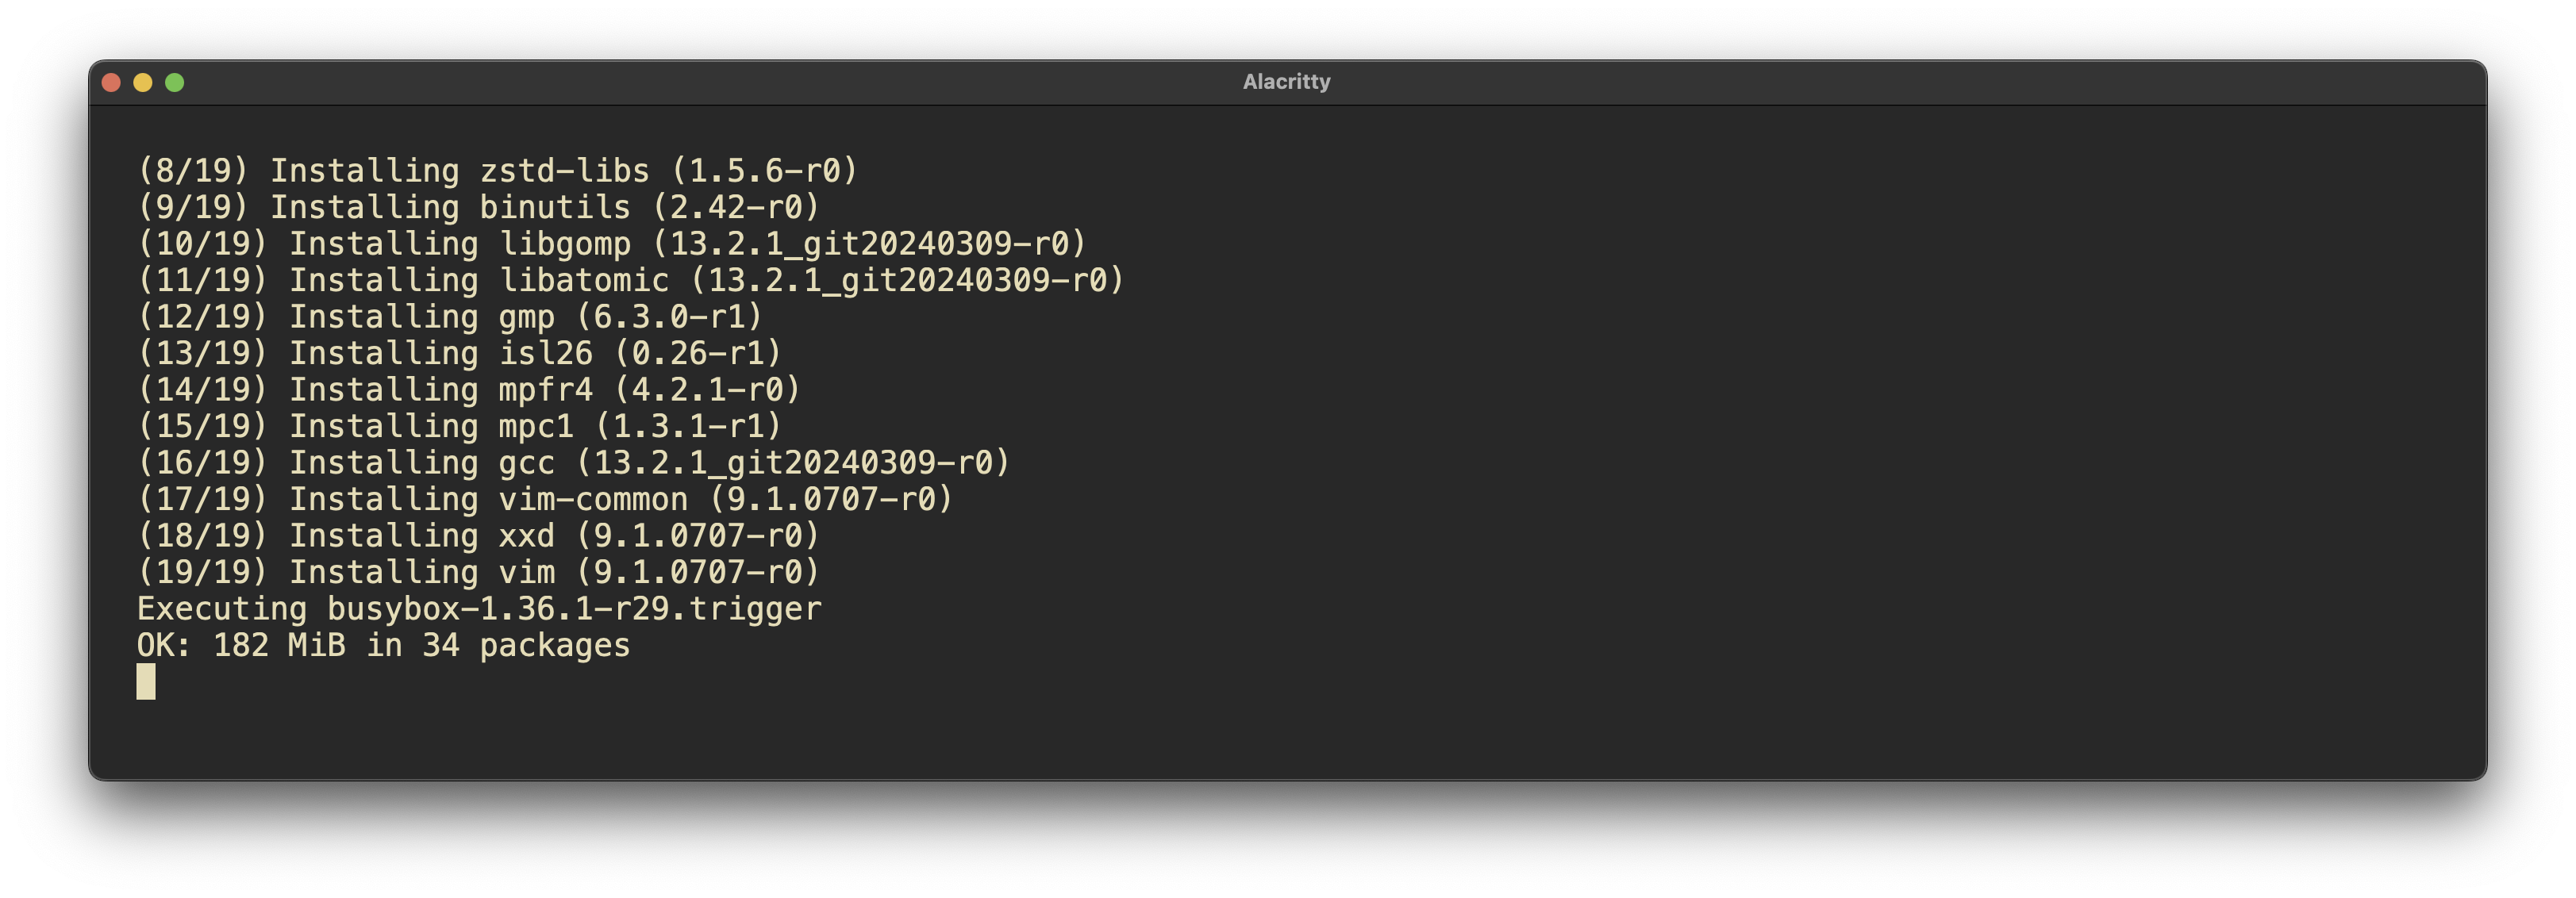
apk add vim gcc bash
I ran into trouble when exiting the container. It will kill the container, forcing me to start it again, which was frustrating.
Having done this in the past, I thought this would not be an issue. However, I just learned that containers without continually running services will die when exited.
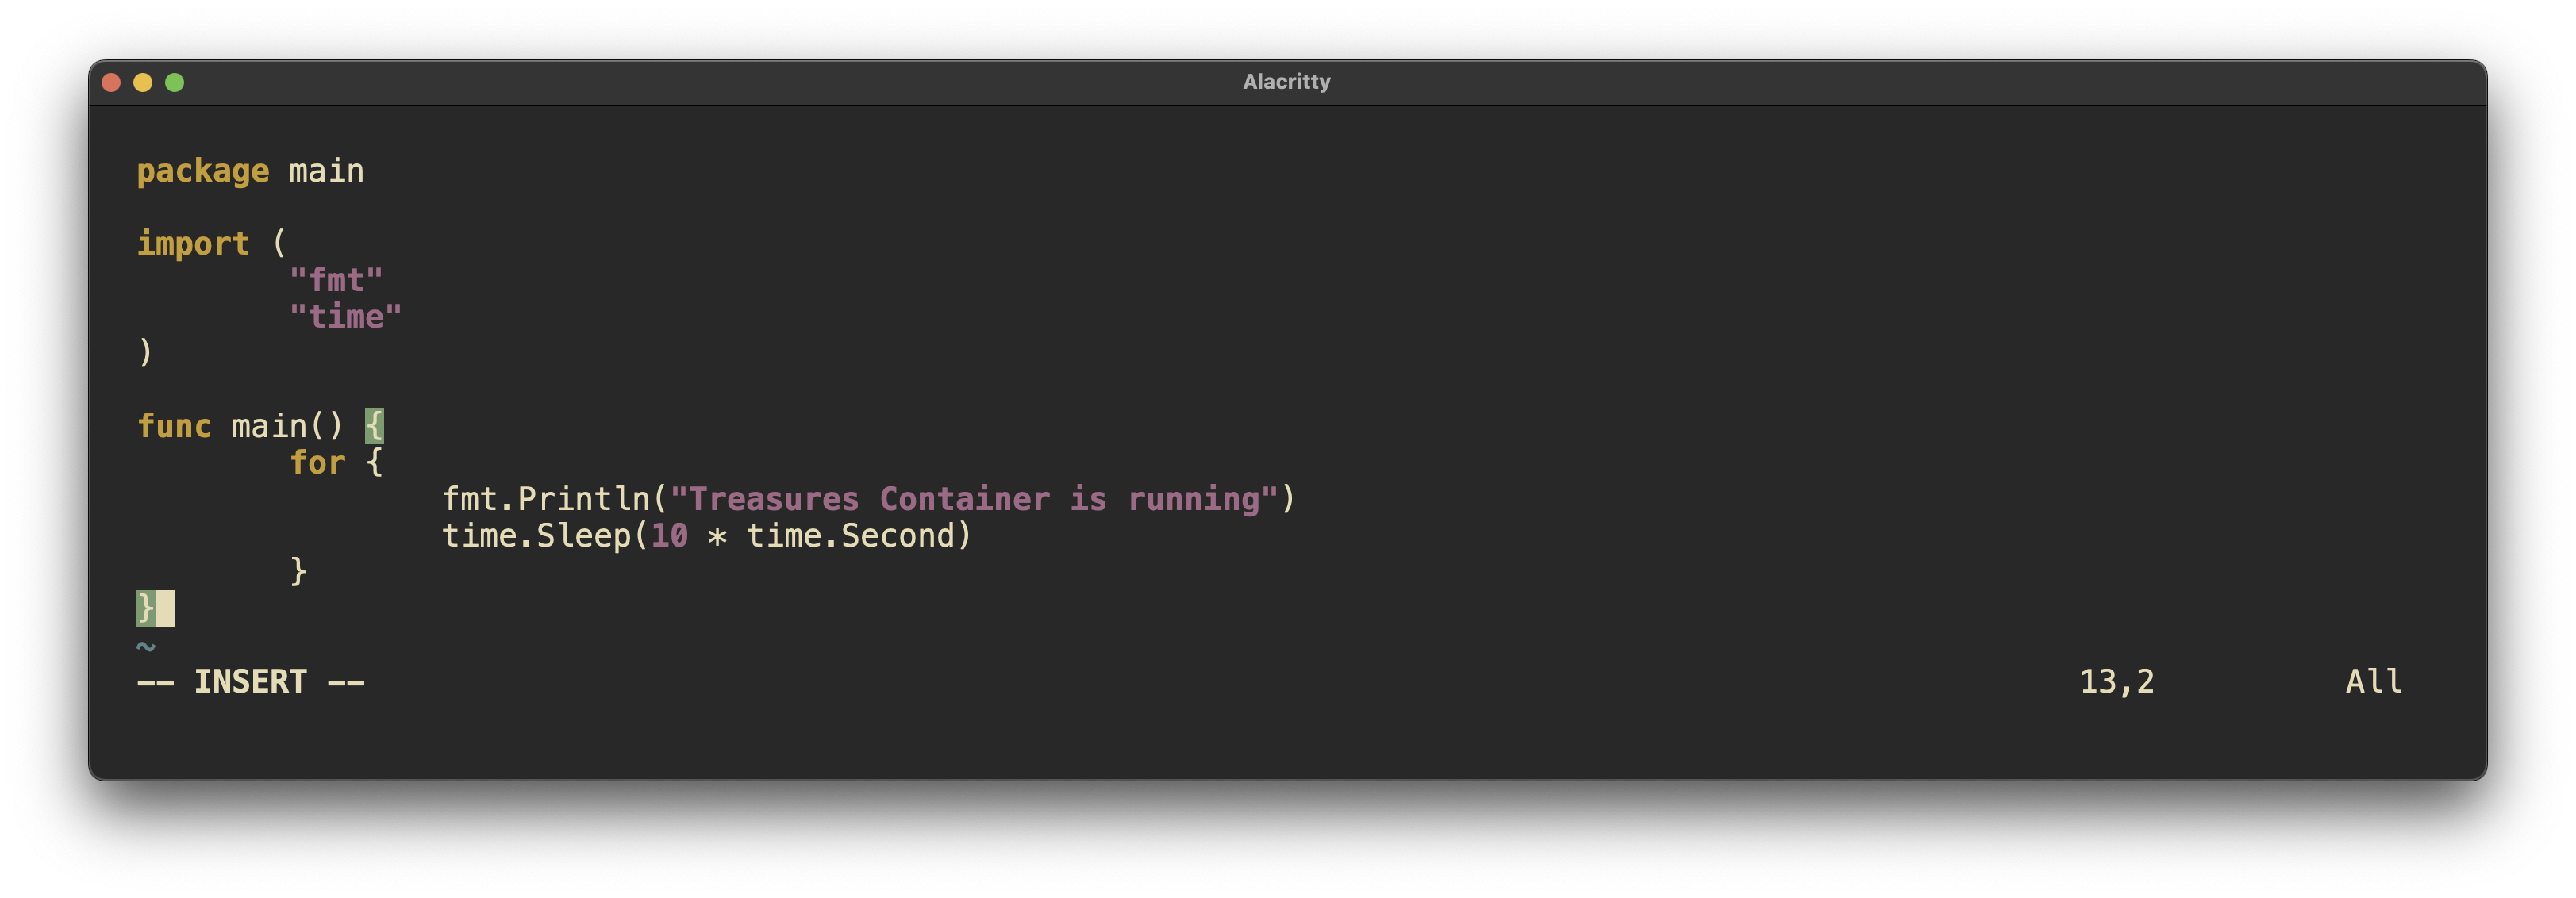
The fix for such an issue is to run something light and persistent on the container in order to keep it alive. This can be accomplished with a bash script or turning a go binary into a system binary to keep running.
Actually, this blog is used to partially keep track of this. I use LogSeq as a second brain, where I will definitely copy and paste this info into my Podman section.
I would like to know more about small scale deployments of Kubernetes such as the one I deployed using Rancher and K3S. More specifically I would like to know what limitations a small scale deployment has versus a multi machine / multi node system.
This content is highly applicable to my intended work as deploying services is becoming increasingly important, as evidenced by the requirement for knowledge of Podman in the RHCSA 9. I already have some container deployment work to display to prospective employers atm. I plan to further my knowledge in this area, especially in regard to Kubernetes as this seems to be the operating system of the internet.
Once again beyond the Discussion Posts and Labbing. I spent a great deal of time scripting/programming System checks. After completing the labs which Bash Scripting and intro to ‘C’, I got really into GO as a system util. I have a particularly productive day with using the embed.fs feature of GO and packing unix system tools together in a single go program at compilation. I think there is a ton of potential here for my own uses. 👨🔧
It’s a 2-week holiday in your country, and most of the engineers and architects who designed the system are out of town. You’ve noticed a pattern of logs filling up on a set of web servers due to increased traffic. Research and verification show that the logs are being sent off in real time to Splunk. Your team has been deleting the logs every few days, but a 3rd-shift engineer missed this in the notes, causing downtime. How might you implement a simple fix to stop-gap the problem until all engineering resources return next week?
Adding more space to /var/log might be a design fix, but it isn’t feasible in the short term due to:
Operational Constraints: Extending storage may involve downtime, additional permissions, or architectural changes that can’t be approved without the primary engineers.
Temporary Nature of the Fix: Increasing space only delays the issue. If logs continue to grow, the problem will recur once space is exhausted again.
Possibility of Log Loss: Higher logrotate frequency could still miss high-frequency log spikes, especially during unusual traffic peaks, risking logs being deleted before Splunk ingestion is complete.
Configuration and Testing: Aggressive logrotate adjustments may interfere with processes expecting logs at specific retention periods. Testing changes in production without key team members isn’t ideal.
To address the issue, consider implementing a temporary fix by configuring a log retention policy that aggressively compresses or truncates logs without disrupting active processes. Here are some potential approaches:
Compress the logs after truncation if additional space savings are needed. Tools like gzip can compress logs efficiently, reducing disk space usage and ensuring logs are still accessible if required for audits or incident investigations.
As a short-term measure, you could set up a RAM disk for logs that don’t need long-term retention. This allows logs to be stored temporarily in memory, reducing disk space pressure. For instance
mount -t tmpfs -o size=512M tmpfs /var/log/temp
You could then configure lower-priority logs to write here temporarily, knowing they will be lost upon reboot, which may be acceptable in a crisis scenario.
If possible, configure the Splunk forwarder to filter logs more aggressively, reducing the volume of logs that are retained on the system. The props.conf or inputs.conf files can be configured to forward logs without keeping local copies.
Adding more space to /var/log might be a design fix, but it isn’t feasible in the short term due to the following:
Operational Constraints: Extending storage could involve downtime, additional permissions, or changes that require architectural decisions that can’t be made without the primary engineers.
Temporary Nature of the Fix: Increasing space only delays the issue rather than preventing it. If the logs keep growing, the problem will recur once space runs out again.
You are the only Linux Administrator at a small healthcare company. The engineer/admin before you left you a lot of scripts to untangle. This is one of our many tasks as administrators, so you set out to accomplish it. You start to notice that he only ever uses nested if statements in bash. You also notice that every loop is a conditional while true and then he breaks the loop after a decision test each loop. You know his stuff works, but you think it could be more easily written for supportability, for you and future admins. You decide to write up some notes by reading some google, AI, and talking to your peers.
Nested if statements are useful for situations where each condition depends on the result of the previous test, requiring a hierarchy or sequence.
A case statement is ideal for handling multiple discrete values of a variable, especially if there are many possible branches. It’s typically cleaner and more readable than a nested if.
Use conditional loops (while) when you don’t know the number of iterations in advance and need to loop based on conditions.
Use counting loops (for) when you have a set number of iterations or are working with a list. This structure is clearer and prevents issues that may arise from unintentional infinite loops.
optimizing or refactoring Bash scripts the Engineer had left me.
I would replace nested if statements with case statements when possible to improve readability, especially when handling multiple discrete values.
Of course, I would comment things for added communication/ maintainability.
I would Limit while true loops to cases where no predictable count or list is available. Clearly define a break condition early to avoid infinite loops.
I would Use for loops for counting or iterating over arrays or lists, as they provide a clean structure with known iteration limits.
As the course progresses, I am learning more deeply within a study group. Aside from the lab work and discussion posts. I have been putting a lot of hours satisfying curiosities regarding the linux system.
For this unit we did a deep dive into packaging, going so far as to look at the history and reasoning before decision making. We had also looked at packages are managed within tightly controlled environments.
I now feel that I have a robust understanding of the theory and practical elements of Redhat packaging and beyond.
Versioning enables you to monitor software updates systematically, making it easier to troubleshoot, roll back changes, and trace modifications for security or functionality purposes. 👍
One can manage dependencies confidently, avoiding conflicts between system components, libraries, and tools. crucial for stable and consistent deployments. 👍
We can verify package integrity, ensuring installed software hasn’t been altered or corrupted. Essential for maintaining a secure and stable system environment. 👍
You are new to a Linux team. A ticket has come in from an application team and has already been escalated to your manager. They want software installed on one of their servers but you cannot find any documentation and your security team is out to lunch and not responding. You remember from some early documentation that you read that all the software in the internal repos you currently have are approved for deployment on servers. You want to also verify by checking other servers that this software exists. This is an urgent ask and your manager is hovering.
How can you check all the repos on your system to see which are active? 🤔
How would you check another server to see if the software was installed there? 🤔
If you find the software, how might you figure out when it was installed? (Time/Date) 🤔
In an urgent situation like this, I’d first check which approved software repositories are active on my system,
then verify if the software is already installed on similar servers to ensure it’s safe to proceed. Finally, I’d review the installation history to confirm when it was
added. Working with Red Hat packaging and package management systems has many more options than I was expecting; through labbing in the study group,
I’ve gained a much better understanding of packages, dependencies, and package management.
Packing was a pretty deep rabbit hole for me.
This is the process I’d follow for this case:
Check Active Repositories
dnf repolist
Check if the Software is Installed on Your System
rpm -qa | grep <software_name>
or
dnf list installed <software_name>
Check Another Server for Software Installation with SSH and Step 2 commands.
View Installation History (Time/Date)
dnf history info <transaction_id>
dnf history list <software_name>
(After you have completed the lab) - Looking at the concept of group install from DNF or Yum. Why do you think an administrator may never want to use that in a running system? Why might an engineer want to or not want to use that? This is a thought exercise, so it’s not a “right or wrong” answer it’s for you to think about.
Software bloat is when essential tools/packages are larger than they need to be, effecting performance, reliability and security. By performance I am referring to the loss of potential performance from unessecary resource use. In regards to reliability, more complex systems inherently have more potential to fail. Security means many things, so I am specifically thinking about attack surface and potential for vulnerability due to the aforementioned complexity.
By targeting specific packages, tracking changes, reducing unnessecary dependancies and bloat, we satisfy the tenants of a security baseline by establishing consistency, simplifying compliance, enhancing efficiency and reduce risk.
In this unit, we explore essential concepts in firewall management using Firewalld and UFW. A firewall acts as a security system, controlling the flow of traffic between networks by enforcing rules based on zones —logical areas with different security policies. Services are predefined sets of ports or protocols that firewalls allow or block, and zones like DMZ (Demilitarized Zone) provide added security layers by isolating public-facing systems. Stateful packet filtering tracks the state of connections, allowing more dynamic rules, while stateless packet filtering inspects individual packets without connection context. Proxies facilitate indirect network connections for security and privacy, while advanced security measures such as Web Application Firewalls (WAF) and Next-Generation Firewalls (NGFW) offer specialized protection against modern threats.
This week, we dove deep into configuring and testing firewall settings in our Discord study group. I had several virtual machines set up in my ProxMox home lab, and we experimented while completing the lab work. As usual, we went on several tangents, verifying ideas. In total, we spent over 5 hours running commands, experimenting with different configurations, breaking things, and debating solutions. By the end of the session, I gained a practical understanding of Firewalld configuration, packet sending, and packet tracing with Wireshark. It was frustrating at times, but ultimately rewarding.
Uses zones to define the level of trust for network connections, making it easy to apply different security settings to various types of connections (like home, public, or work). It’s dynamic, meaning changes can be made without restarting the firewall, ensuring smooth operation.
The concept is specific to Firewalld. Zones are a predefined set of firewall rules that determine the level of trust assigned to a network connection. Zones allow you to apply different security policies to different network interfaces based on how much you trust the network.
Uncomplicated Firewall is a user-friendly firewall designed to simplify the process of controlling network traffic by allowing or blocking connections. UFW is commonly used on Ubuntu and provides easy commands for setting up firewall rules, making it ideal for beginners. Despite it is simplicity, it is powerful enough to handle complex configurations.
By default, UFW denies all incoming connections while allowing outgoing ones. This enhances security by requiring users to explicitly allow any incoming traffic.
Web Application Firewall is a security system designed to protect web applications by filtering and monitoring HTTP traffic between a web application and the internet. It helps prevent common web-based attacks like SQL injection, cross-site scripting (XSS), and cross-site request forgery (CSRF) by analyzing the incoming and outgoing traffic and blocking malicious requests. Unlike traditional firewalls that focus on network security, a WAF specifically targets the security of web applications and can be an important part of a layered defense strategy.
are generally more sophisticated than Firewalld or UFW because they operate at the application layer (Layer 7) of the OSI model. Blocking traffic is one thing, but packet inspection is another.
Next-Generation Firewall is an advanced type of firewall that goes beyond traditional firewall features like packet filtering. It combines standard firewall capabilities with more advanced functionalities such as deep packet inspection (DPI), intrusion prevention systems (IPS), and application-level control. NGWs can inspect and control traffic at a more granular level, allowing administrators to set security rules based on specific applications, users, or behaviors.
Deep Packet Inspection (DPI): Examines the content of data packets, not just their headers, allowing the firewall to identify and block threats hidden in the traffic.
Intrusion Detection and Prevention System (IDS/IPS): Monitors network traffic for suspicious activity and can take action (like blocking or alerting) to prevent attacks in real-time.
Application Awareness and Control: Recognizes and manages specific applications (e.g., Facebook, Skype) regardless of port or protocol, allowing for fine-grained traffic control.
Advanced Malware Protection (AMP): Detects and blocks malware using both signature-based detection and behavioral analysis to prevent malware from entering the network.
SSL/TLS Decryption: Decrypts encrypted traffic (HTTPS) for inspection to detect threats hiding inside secure channels.
User Identity Integration: Applies firewall rules based on user identity or group membership rather than just IP addresses, providing more flexible access control.
Threat Intelligence Feeds: Uses real-time threat data from global databases to protect against emerging threats and malicious IP addresses or domains.
Cloud-Delivered Security: Provides scalable and flexible cloud-based protection services such as sandboxing, traffic analysis, and updates for zero-day attacks.
Virtual Private Network (VPN) Support: Allows secure, encrypted connections for remote users or between different networks (site-to-site or remote access VPNs).
URL Filtering: Controls access to websites based on categories (e.g., social media, gambling) or specific URLs, helping enforce acceptable use policies.
Quality of Service (QoS): Prioritizes certain types of traffic, ensuring that critical applications receive the necessary bandwidth and reducing congestion.
Zero-Trust Network Segmentation: Implements policies based on strict access control, ensuring that users and devices only access the resources they are explicitly permitted.
Sandboxing: Isolates suspicious files or code in a secure environment to detect malicious behavior without affecting the rest of the network.
Logging and Reporting: Provides detailed logs and reports on network traffic, blocked threats, and firewall activity for auditing and troubleshooting.
I am familiar with PfSense as it is Open Source and popular among the Homelab enthusiasts because it is offers expansive features built upon FreeBSD which has killer networking.
Commercial NGFWs (e.g., Palo Alto Networks, Cisco Firepower) often come with built-in advanced features such as cloud-delivered threat intelligence, AI-powered threat detection, and sandboxing for zero-day threats. While pfSense can be extended with third-party packages, it doesn’t natively offer the same level of seamless integration or automation.
Commercial NGFWs typically provide a centralized management console for handling multiple firewalls across large networks. While pfSense can handle multiple installations, managing them requires more manual effort and may not be as streamlined as the enterprise-grade management consoles of commercial NGFWs.
pfSense relies on community and third-party support, whereas commercial NGFWs offer direct vendor support with service level agreements (SLAs), which can be crucial for large enterprises needing guaranteed response times and assistance.
NGFWs like those from Palo Alto or Cisco often integrate with real-time global threat intelligence networks, offering constant updates about emerging threats. While pfSense can be configured with tools like Snort for intrusion detection, it lacks the built-in, cloud-powered intelligence found in commercial NGFWs.
A ticket has come in from an application team. Some of the servers your team built for them last week have not been reporting up to enterprise monitoring and they need it to be able to troubleshoot a current issue, but they have no data. You jump on the new servers and find that your engineer built everything correctly and the agents for node_exporter, ceph_exporter and logstash exporter that your teams use. But, they also have adhered to the new company standard of firewalld must be running. No one has documented the ports that need to be open, so you’re stuck between the new standards and fixing this problem on live systems.
-t: Show TCP sockets.
-u: Show UDP sockets.
-l: Show listening sockets, i.e., those waiting for incoming connections.
-n: Show the output numerically, without resolving service names (e.g., display IP addresses and port numbers instead of domain names or service names like “http”).
Basically all of the concepts used are new to me. I am not very well versed in networking, network scanning or inspecting service configs.
So this became a research and practice exercise that has shown me quite a lot of new tricks.
A manager heard you were the one that saved the new application by fixing the firewall. They get your manager to approach you with a request to review some documentation from a vendor that is pushing them hard to run a WAF in front of their web application. You are “the firewall” guy now, and they’re asking you to give them a review of the differences between the firewalls you set up (which they think should be enough to protect them) and what a WAF is doing.
This report has been prepared in response to a request to evaluate the suitability of implementing a Web Application Firewall (WAF) within our infrastructure. The aim of this report is to:
Compare WAF technology with traditional firewall solutions currently implemented.
Without WAF: Increased vulnerability to web application-specific threats, such as cross-site scripting (XSS) and SQL injection, especially for critical applications.
With WAF: Increased security for web applications but requires ongoing monitoring and adjustment to ensure performance and efficacy.
Based on the evaluation, I recommend the following:
Implement a WAF: Due to the increasing reliance on web applications and the rise in web-based attacks, implementing a WAF would provide an essential layer of security.
Maintain Traditional Firewalls: Existing firewalls should continue to be used for network-level protection alongside the WAF.
Pilot Implementation: Begin with a limited deployment of WAF for high-risk applications to evaluate performance and cost before a full-scale rollout.
Staff Training: Ensure the security and IT teams are trained in WAF management to maximize its effectiveness.
The implementation of a Web Application Firewall is a strategic move to protect our web applications from evolving security threats. While traditional firewalls remain crucial for network security, they cannot defend against the types of attacks WAFs are designed to mitigate. By implementing both WAF and traditional firewall solutions, we can ensure comprehensive security coverage across both network and application layers.
Firewall: A security device that monitors and controls incoming and outgoing network traffic based on predetermined security rules.
Zone: A defined area within a network that contains systems with similar security requirements, separated by a firewall.
Service: A specific type of network functionality, like HTTP or DNS, that can be allowed or blocked by a firewall.
DMZ: A “Demilitarized Zone” is a network segment that serves as a buffer between a secure internal network and untrusted external networks.
Proxy: A server that acts as an intermediary for requests between clients and servers, often used for filtering, security, or caching.
Stateful packet filtering: A firewall feature that tracks the state of active connections and makes filtering decisions based on the connection’s state.
Stateless packet filtering: A type of firewall filtering that analyzes each packet independently without considering the state of the connection.
WAF: A Web Application Firewall that protects web applications by filtering and monitoring HTTP/HTTPS traffic for threats like SQL injection and XSS.
NGFW: A Next-Generation Firewall that combines traditional firewall functions with additional features like application awareness, integrated intrusion prevention, and advanced threat detection.
The overarching theme of this Unit is in the title, we are looking at Managing Users & Groups. Managing users and groups in Linux within an enterprise involves creating, modifying, and organizing user accounts and permissions to enforce security and control over resources.
Organizing permissions to enforce security is more important than it has ever been, as we live in a hyper connected world with many bad actors and large amounts of sensitive data.
Linux is fundamentally well suited for Managing Users & Groups because permissions permeate every aspect of a Linux environment. Everything is a file and every file has associated permissions, Therefore we have granular control over the comings and goings of users as administrators.
Looking at etc directories relating to Users, Groups and Associated Security
/etc/passwd
contains essential information about users, including their username, user ID (UID), group ID (GID), home directory, and default shell, with each entry separated by a colon.
/etc/group
stores group information, listing each group’s name, group ID (GID), and its members, with each entry separated by a colon, allowing users to belong to one or more groups for access control purposes.
/etc/shadow
contains encrypted password information and related security details for user accounts, such as password aging and expiration
/etc/gshadow
stores encrypted passwords for group accounts, as well as information about group administrators and members, providing enhanced security for group access by restricting who can modify or access specific group data.
/etc/login.defs
configuration settings for user account creation and login parameters, such as password aging policies, UID and GID ranges, and the default paths for user home directories, helping to control system-wide authentication behavior.
/etc/skel/
provides template files that are automatically copied to a new user’s home directory when the user is created, ensuring they have default configuration settings.
This file contains information about disk partitions and other block storage devices and how they should be automatically mounted during the boot process.
Permissions: Usually -rw-r–r– (readable by all users, writable only by the root).
/etc/hostname
This file stores the system’s hostname, which is a unique identifier for the machine in a network.
Permissions: Usually -rw-r–r– (readable by all users, writable only by the root).
/proc
This is a virtual filesystem that provides detailed information about processes and system resources. It does not contain actual files but rather system and process information in real-time.
Permissions: dr-xr-xr-x (readable and executable by all users, writable only by root).
/boot
Contains the kernel, initial ramdisk, and bootloader files needed to start the system.
Permissions: drwxr-xr-x (readable and executable by all users, writable only by root).
/root
This is the home directory for the root user (the system administrator).
Permissions: drwx—— (only root has read, write, and execute permissions).
/usr/bin
Contains binary executables for user programs.
Permissions: drwxr-xr-x (readable and executable by all users, writable by root).
Het’ server is unique to me. He uses an injest system that makes a jump to the actual server for security purposes. Within the main server we have a warewulf managed cluster running a series of Rocky Linux VM’s. ⛰
Since we will be doing this from one of the Rocky Nodes within the system, the jump server will not be an issue I recon. 🤔
So I shouldn’t just pop into the server and go willy nilly with scanning commands. This sever is managed by someone who understands security. So it is best to do some Dead Reckoning beforehand.
Mapping the remote servers open ports with nmap.
nmap stands for Network Mapper. A quick perusal of the man page states it is an exploration tool and security / port scanner. It was designed to rapidly scan large networks. Nmap uses raw IP packets in novel ways to determine what hosts
are available on the network, what services (application name and version) those hosts are offering, what operating systems (and OS versions) they are running, what type of packet filters/firewalls are in use, and dozens of other characteristics.
In order to Map the network I am going to use the ip address for the argument/target of the nmap command.
nmap <server-ip>
Checking mounted filesystem’ with df. stands for Display Free disk space. It is a utility that displays statistics about the amount of free disk space on the specified mounted file system or on the file system of which file is a past.
I will be using the -h flag for human readable format, which ads unit suffixes eg. Gibibyte (GiB) to the ends of values. There is more to it, but I am mentioning the bread and butter of the flag.
nmap is actually a big command, by big I mean the number of options and capabilities are vast. It is quite popular with pen testers and is packaged with Kali Linux – a security analysis and exploitation focused distribution of Linux, so best believe it is something important. This essentially means I should take some time to get to know it more.
Beware that nmap can and will trigger detection software like an active firewall, because nmap is conducting Funny Bizniz by way of packet trickery inside a network, both are technical terms. Luckily there is a stealth option ( -s ) that enables the mapping to take place un-detected –for the most part.
Contrary to what I assumed, the lower case s does not even stand for stealth, though it still helps as a mnemonic. No, it actually stands for SYN and
SYN stands for Synchronize. It is part of the TCP three-way handshake, which is a process used to establish a reliable connection between two devices on a network and has nothing to do with guys meeting at a bar.
I thought we were trying to be stealthy, not synchronized 🤔
Well is actually a form of Funny Bizniz wherein SYN is sent and never acknowledged, thustly not completing the handshake process and therefore hiding activity somehow
but how? Well… it reduces the chance of being logged by the target system’s monitoring tools, such as firewalls or intrusion detection systems. Now we both know.
Keep in mind this is only one command option, just imagine how deep the rabbit hole goes.
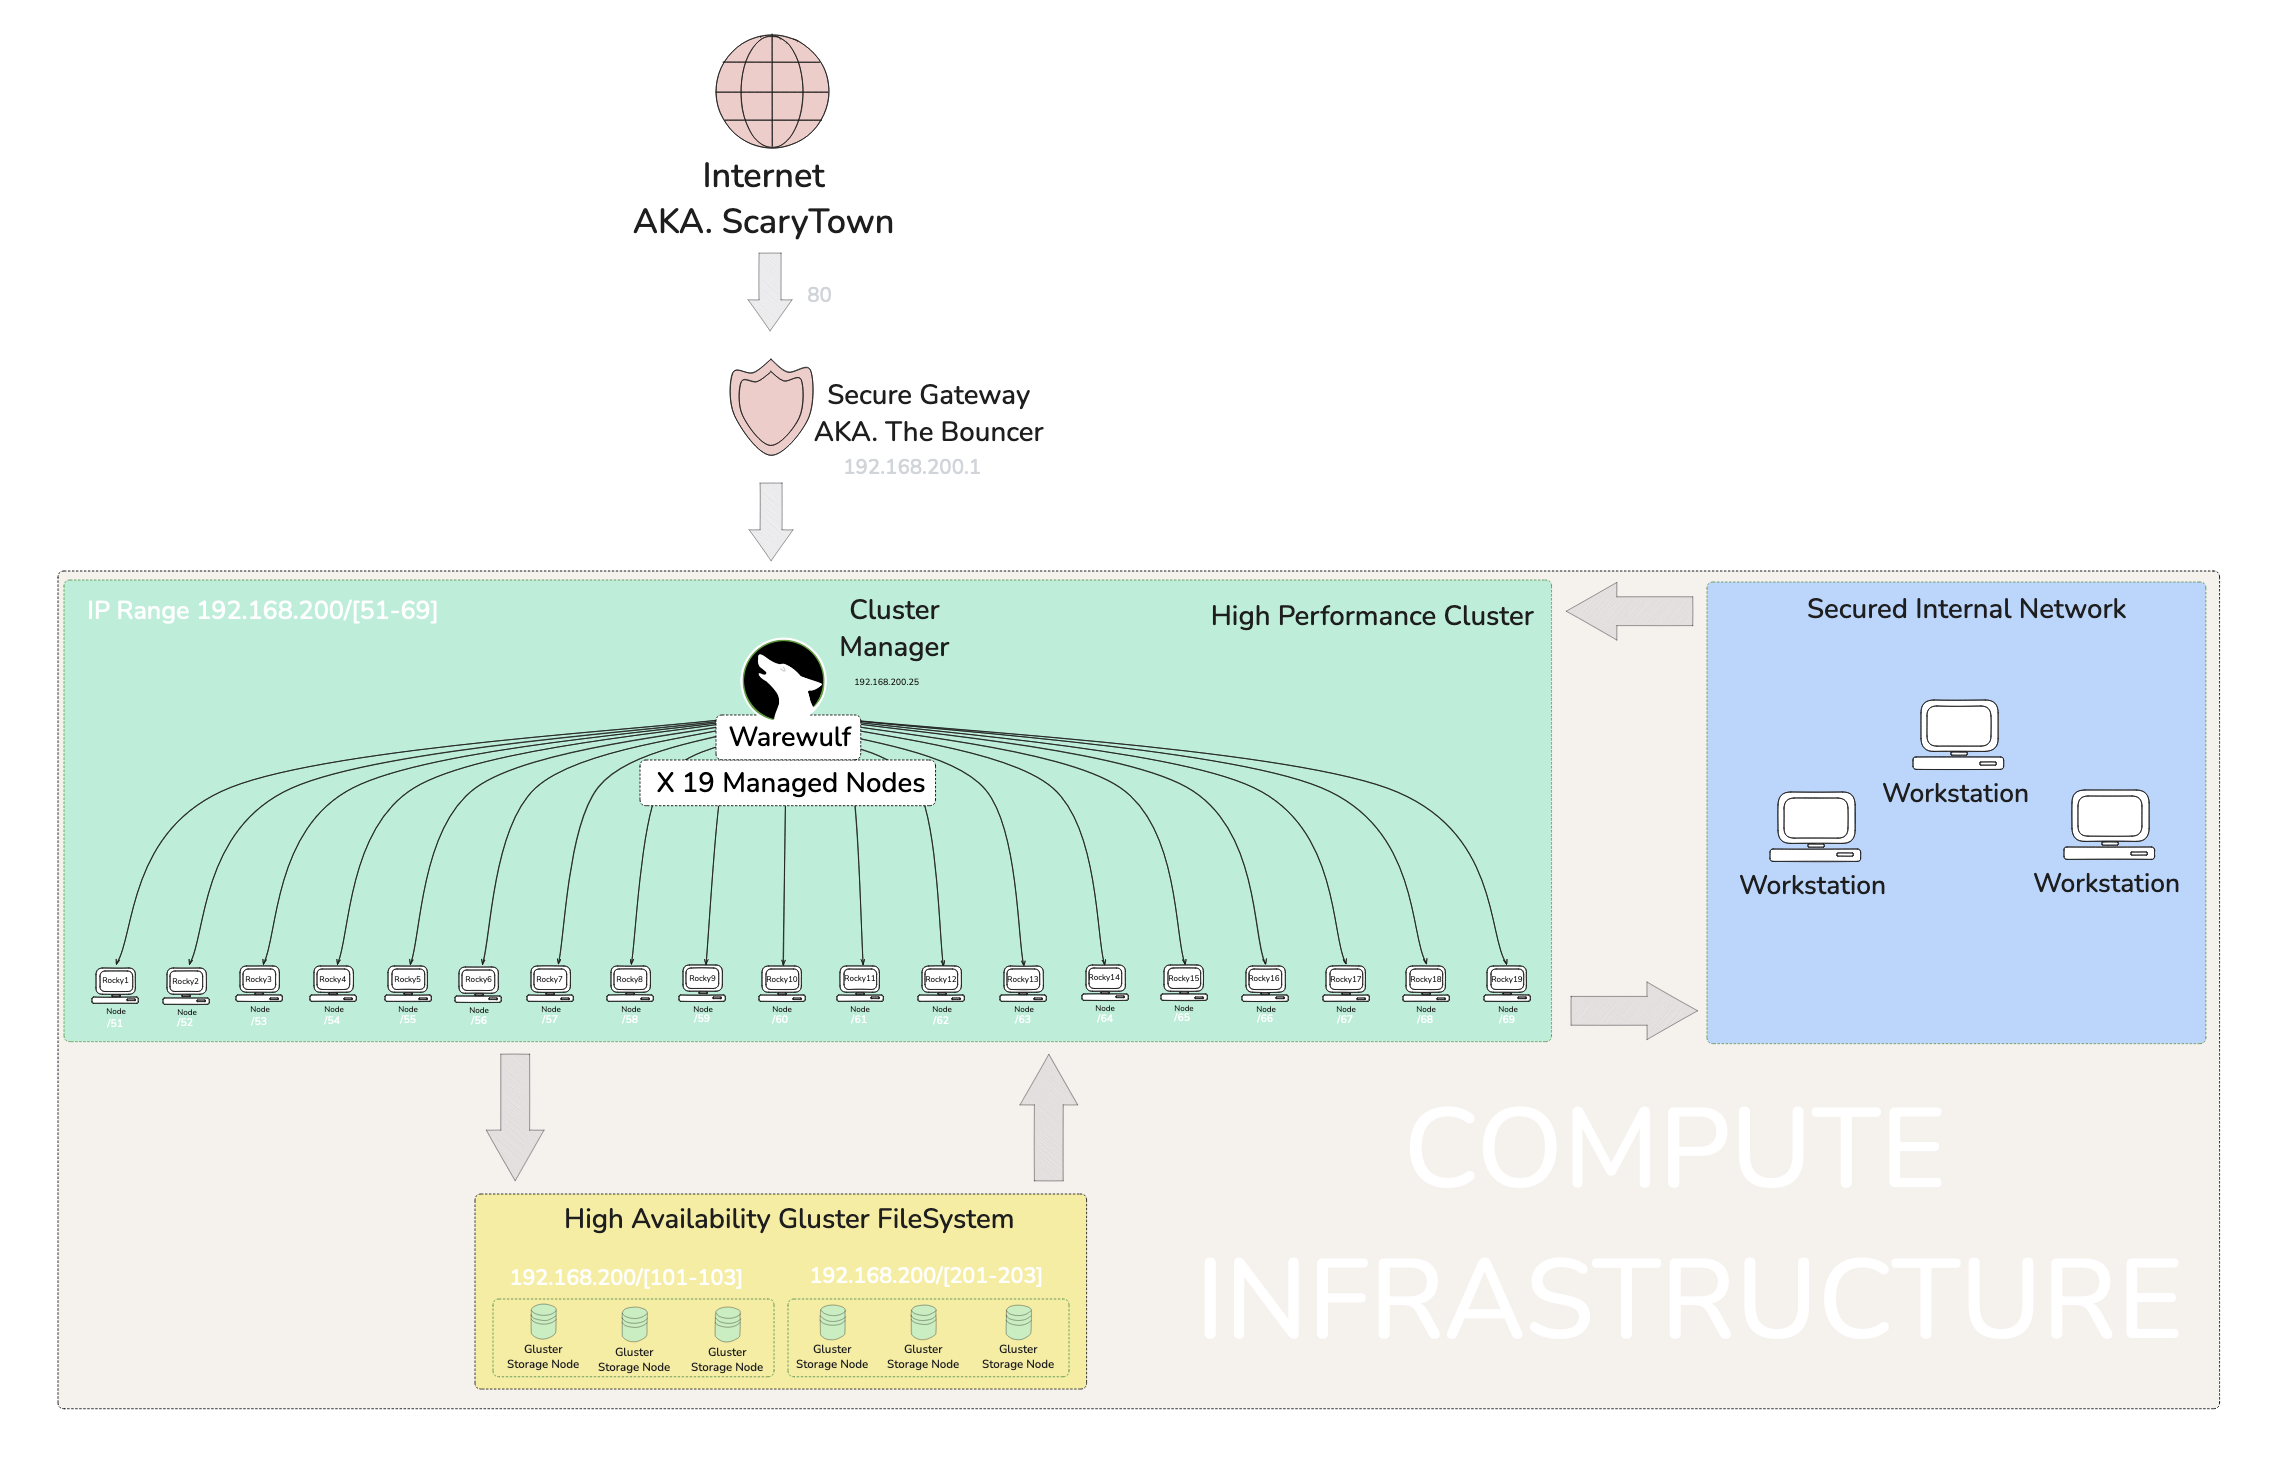
The network is safely tucked behind a Dynamic Domain Name System (DDNS) running on an Asus Router. This setup allows access from a WAN, in this case, The Internet (if you’ve heard of it 🌐). It securely gate-keeps the network via login credentials, because let’s be honest, the Internet can be a scary place with bots… and sometimes people 👀.
So, what exactly does DDNS do? Well, I’m glad you asked! Most home internet connections don’t offer a static IP address, which makes hosting things tricky because the IP will randomly change. The IP is dynamic for a few reasons, including cost savings and the limited availability of IPv4 addresses. Anyway, I’m getting off track 🛤️. A DDNS monitors this dynamic IP and links it to a stable address that stays fixed.
TL;DR: DDNS bonds a dynamic IP with a fixed address, offering the added bonus of hiding the internal IP from bad actors, or as I like to call them, the baddies in London 🕵️♂️. So, this network has a DDNS gateway in place for that extra layer of security 🔒.
Once a credentialed fellow enters their login while hanging at the gateway, a list of servers appears, like a digital menu 🍽️. From this list, one can choose where to jump to. In my case, I leapt to Rocky12, a node within a managed cluster. I knew a little about this network thanks to earlier sessions, but most of this can also be discovered by doing some network scanning 🕵️.
This is where the magic of nmap comes into play! I used two stealthy commands: nmap -sS and nmap -sT. The sT option scanned a wide range of ports and connections, giving me a detailed list that I piped into less for easier viewing 📜.
I grepped all the IP addresses and ran an -sS SYN Scan to gather more details on each node. These scans revealed loads of information about open ports and, in some cases, the hostnames of devices 🎯.
I quickly identified the warewulf orchestration device and all of the Rocky nodes. However, a few mysterious devices needed some detective work 🔎. I noticed glrpc listed as a service while scanning six addresses—three on one IP range and three on another. A quick Google search revealed that glrpc relates to GlusterFS, a filesystem specific to Red Hat systems. After watching a video explainer on GlusterFS, I figured out that these two IP ranges were likely a RAID or high availability configuration 💾.
I initially created a highly technical Engineer’s map filled with data and presented it to Het for feedback. He advised me to think about how management would interpret it 🤔. So, back to the drawing board! I focused on improving the visual presentation and labeling, keeping in mind that management doesn’t care about the nitty-gritty; they just need a clear, high-level understanding during briefings 📊.
This concludes my exercise in mapping an unknown network! I learned a lot from this experience and am quite proud of the outcome 💪. It will undoubtedly come in handy when I find myself in future scenarios with many unknowns.
Lateral movement in the context of cyber exploitation refers to an attacker’s strategy of moving across a network to gain access to additional systems or sensitive data after initially infiltrating a single point. This involves leveraging compromised credentials, escalating privileges, or exploiting vulnerabilities to navigate between hosts and systems. The objective is often to broaden access within the environment while avoiding detection, eventually targeting critical infrastructure or data.
Exfiltration 🧳🚀
refers to the unauthorized transfer of data from a target system or network to an external location controlled by an attacker. This can involve methods such as encrypted tunnels, covert channels, or compromised accounts to avoid detection. Exfiltration is typically the final step in a cyberattack, allowing attackers to steal sensitive data, intellectual property, or credentials for further malicious activities.
The impacts of data exfiltration can be massive. Given the level of severity an exfiltration incident can entirely destroy an organization or cause financial losses, reputational damage, labour force diversion, data loss and jeopardizing future security.
The Linux user environment is a customizable space that includes settings like environment variables, shell configurations, and startup scripts, typically defined in files such as .bashrc or .profile. These configurations allow users to tailor command line behavior, automate tasks, and create a personalized and efficient working environment.
Customizations for the user environment in Linux might include setting up aliases for frequently used commands, configuring environment variables, and adding functions to streamline workflows. These changes can make repetitive tasks faster, improve the command line interface’s convenience, and adapt the environment to personal preferences.
Problems around helping users with their dot files often stem from the diverse and sometimes incompatible changes users make to suit their needs. This can lead to issues like conflicting configurations, inconsistent behavior across systems, or difficult debugging when unexpected behaviors arise from custom scripts.
Footprinting is an essential phase in ethical hacking and system security. It involves gathering information about a computer system, network, or organization to understand its structure and identify potential vulnerabilities. Footprinting is often the first step of a cyberattack or penetration test, allowing attackers or security professionals to map out an environment before deciding how to approach the next steps.
Scanning is a process of actively probing systems or networks to identify open ports, services, and vulnerabilities. It’s used by attackers to gather deeper insights for potential exploitation and by security professionals to assess weaknesses. Common tools include Nmap and Nessus, while defenses include firewalls and IDS/IPS systems.
Enumeration is the process of extracting more detailed information about a target, such as usernames, network shares, and system services, after identifying open ports and active systems. It typically involves active engagement with the target to gain in-depth knowledge that can be used for exploitation.
System hacking is the process of gaining unauthorized access to individual systems or networks by exploiting vulnerabilities. It involves activities such as password cracking, privilege escalation, installing backdoors, and covering tracks. Ethical hackers use these techniques to assess system security and recommend protective measures.
Privilege escalation is the process of gaining higher-level permissions or privileges than initially granted, allowing an attacker to execute commands with elevated authority. This can be achieved through exploiting vulnerabilities or misconfigurations, leading to unauthorized access to restricted resources or system control.
The Rule of Least Privilege (LoP) is a security principle that states users, applications, and systems should only be granted the minimum level of access or permissions necessary to perform their tasks. This helps reduce the attack surface, limit potential damage from breaches, and mitigate insider threats.
Covering tracks is the process attackers use to hide their unauthorized activities and avoid detection. This involves techniques such as deleting or modifying system logs, using rootkits, and clearing command histories to prevent system administrators or security teams from discovering their presence or actions.
Planting backdoors involves installing hidden access points in a system, allowing attackers to bypass regular authentication and gain unauthorized access at a later time. Backdoors can be inserted through malicious code, vulnerabilities, or modifications to existing software, making them useful for maintaining persistent control over compromised systems.
Recently, I was chatting with fellow enthusiasts in the ProLUG group about creating system utilities with Go.
Between learning about it on my own time and getting input from others, I realized there are so many compelling reasons for using Go as a utility language. 🛠️
Currently, the idea isn’t as prevalent as Python or Bash, but it’s gaining traction. This makes sense since Go was designed with modern, interconnected systems in mind.
A system utility streamlines repetitive tasks by offering custom commands tailored to your workflow, boosting efficiency for system administrators and engineers. Work smarter, not harder. 💡
Go offers a package called Cobra CLI 1, which enables the creation of command-line interfaces that take input from the terminal and execute predetermined logic. I’m putting this simply in case you’re unfamiliar with how programs work 😆.
The CLI is the simplest form of a computer program and is perfect for Linux system folks.
The core idea of this article is to explain how a Go program can act as a personalized utility that lives on your system or can be deployed across many. Go compiles code into a binary—native computer language. Once built, the binary runs reliably without failure, assuming the program logic is solid. This makes Go ideal for utilities that are called repeatedly to perform simple tasks.
Managing systems involves a lot of repetitive tasks, and the goal of any sysadmin or engineer is to automate them. Tools like Ansible, Python, and Bash are already well-known for automation. However, there are specific reasons to use Go, which I’ll explore further in a future article titled “Why Go?” where I’ll break down why it belongs in your quiver of tools 🏹.
To complete the Professional Linux User Group (ProLUG) Professional Administrator Course (PAC), we are required to submit a final Capstone Project.
This article is a bit out of order, as I proactively chose a project topic before it was formally introduced. The purpose of this article is to document the project requirements as set out by our instructor.
Of course, I like to make slight modifications to ensure everything is neatly formatted and grouped—with plenty of emoji usage for extra flair! 😉