In this week’s Brown Bag session, we discussed the operation of running systems. This refers to when systems are live and possibly being accessed by users. During this time, we inspect settings, configurations, logs, and monitor running processes.
cd ~ # Change Directory to Home

ls # list

mkdir unit4 # Create a Directory named unit4

mkdir unit4/test/round6 # This fails 🙅, because the -p option is not invoked

mkdir -p unit4/test/round6 # This works because the Parent option -p is enables allowing for sub directories ✅

cd unit4 # Change to unit4 directory

man ps # View the manual for the ps command 👀

ps -ef # -e Display information about other users processes, including those without controlling terminals. -f Display the uid, pid, parent pid, recent CPU

ps -ef | grep -i root #PID 0, the process ID is zero

ps -ef | grep -i root | wc -L #this command could be helpful because within the root processes it finds the process with the longest line. This could help with finding resource heavy processes or identifying complex commands

top
fdisk -l #list partition tables

ls /dev/sd* #lists disks, with a wildcard at the end

pvs #physical volumes, Volume group and format

vgs #Volumes Groups

lvs #Logical Volumes

pvdisplay # More Comprehensive listing of Physical Volumes

vgdisplay # More Comprehensive listing of Volume Groups

lvdisplay # More Comprehensive listing of Logical Volumes
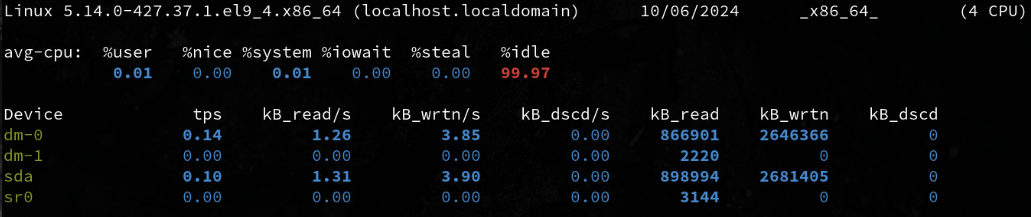
iostat -d # Displays only device statistics

iostat -d 2 # Displays only device statistics in 2 second increments

iostat -d 2 5 # Displays only device statistics in 2 second increments for a total of 5 seconds
cat /proc/meminfo # a very comprehensive listing of memory info that spans multiple pages

free # Displays **Memory** and **Swap** Space usage

free -m # Diplays **Memory** usage in Mebibytes 1024 bytes MiB

🍼 I was today years old when I learned what a Mebibyte is 😄
cat /proc/cpuinfo

cat /proc/cpuinfo | grep proc | wc –l

iostat -c

iostat -c 2 # Runs CPU options in 2 second intervals.

iostat -c 2 5 # I had run this command before, in two second intervals for a total of 5 seconds
last # vertical list of users ttys

last | more # more allows me to scroll through

w # Display detailed info about currently logged in users

who # Prints basic info about users currently logged in

whoami # Just lists your user name
ps -aux | more # sending all listed processes to more

ps -ef | more # list every process

ps -ef | wc -l # counts the number of lines from a full format listing
Collects and consolidates events and alerts from network devices, servers, applications, and security systems. Applies correlation and filtering to identify meaningful incidents and prioritize them based on service impact.
Captures, tracks, and escalates incidents. Facilitates collaboration and prioritization, ensuring timely resolution with historical insights and knowledge base integration for faster fixes.
Analyzes events, performance data, and logs to uncover the root causes of incidents. Uses data analytics to correlate related events and identify underlying issues affecting service availability.
Provides customizable dashboards and reports to visualize the health, performance, and availability of IT systems. Allows stakeholders to monitor key metrics, track service-level agreements (SLAs), and gain insights into overall system performance.
Includes automation capabilities for routine IT tasks like system restarts, service provisioning, and configuration changes. Reduces manual effort, increases efficiency, and minimizes human errors.
The term Operations Bridge is relatively new to me. I would’ve called this a Unified Dashboard. The idea of bridging operations by consolidating and unifying data makes sense, but it’s a bit more complex than just a simple dashboard.
The dashboard and reporting capabilities are the most critical. Seeing everything at a glance is invaluable. Other features can often be achieved using smaller tools like Cron jobs, Ansible, Bash, or Prometheus.
The complexity is a major drawback. Constant tweaking seems inevitable in the ever-changing IT landscape. Large organizations with stable, long-term systems may benefit most, but the potential for cascading errors, like in Chernobyl, comes to mind when a single feedback loop causes widespread failures.
Your team lacks documentation on how to check out a server during an incident. Develop a procedure detailing what an operations person should do when a system is suspected of malfunctioning.
If possible, take a snapshot of the current system. Treat it like a crime scene—nothing should be disturbed or altered. This snapshot is crucial for forensic analysis of the system’s state.
A Battle Drill is a standard operating procedure used in infantry training. It’s based on common scenarios that require rapid, collective action. By practicing battle drills, a team can react quickly and efficiently to dangerous situations without the need for complex decision-making.
Battle drills prepare infantry for swift, organized, and aggressive responses to high-stress situations such as explosions, direct fire, flashing lights, chemical exposure, or sudden assaults.
Battle Drills are for those moments when everything is going wrong and you need a reactionary response.
— Scott Champine
⏱️ Reaction time and mental readiness are key to success.
In real incidents, there’s often no time to plan a response. For regular operations, we have the luxury of preparation and research, but in high-stress, mission-critical situations, the pressure can become overwhelming, potentially leading to paralysis. Preparedness through practice is essential.
In the infantry, this means knowing how to load, reload, field-strip, and fire a weapon, or apply first aid using a trauma kit to save a fellow soldier.
These concepts are equally valuable in system operations. Knowing how to run basic commands, troubleshoot issues, break down problems, and write scripts all fall under knowing your tools. Just as a soldier must be able to handle their equipment with their eyes closed, an operator must be fluent in the commands, tools, and procedures they rely on daily. This level of expertise comes from memorizing commands, knowing paths, and practicing scripting.
A few months before this course, I realized that to deepen my understanding of systems, I needed to take extensive notes I could easily refer back to. After doing thorough research on different note-taking systems, I concluded that LogSeq5 was the best fit for my needs.
Since adopting LogSeq, I’ve taken an immense amount of notes. I’ve also created a lot of cheat sheets and references, thanks to LLMs and various GitHub repositories. Let’s just say my note-taking game has been strong.
When this course started, I knew that note-taking would be a big component. Most of my notes are private since I prefer to write candidly, sometimes using strong language. To share more polished, public-friendly notes, I created this HUGO blog. I’m a stickler for clean layouts, typesetting, and readability, so filling out pre-formatted documents isn’t my style.
Btrfs stands for B-tree File System, not “Better File System,” though it’s easy to see why people might think that. I believe Btrfs is the future for both small and large-scale projects, as it reduces the need for manual and automated maintenance, while simplifying backup and restoration processes.
This article aims to shed light on the history and motivation behind creating Btrfs, its core functionality, and the standout features that set it apart from the competition.
The idea for Btrfs was first proposed by IBM researcher and bioinformatician Ohad Rodeh at a USENIX conference in 2007. The goal was to develop a copy-on-write (COW)-friendly B-tree algorithm, which would allow for efficient data storage and retrieval without the overhead typical of other file systems.
As Valerie Aurora explained:
“To start with, B-trees in their native form are wildly incompatible with COW. The leaves of the tree are linked together, so when the location of one leaf changes (via a write—which implies a copy to a new block), the link in the adjacent leaf changes, which triggers another copy-on-write and location change, which changes the link in the next leaf… The result is that the entire B-tree, from top to bottom, has to be rewritten every time one leaf is changed.” – Valerie Aurora1
Chris Mason, a core developer of the Reiser Filesystem, liked the idea and saw an opportunity to move beyond Reiser, which used B-trees but wasn’t optimized for COW. Mason brought the idea to his new job at Oracle, where development of Btrfs began in earnest.
“I started Btrfs soon after joining Oracle. I had a unique opportunity to take a detailed look at the features missing from Linux, and felt that Btrfs was the best way to solve them.” – Chris Mason2
In collaboration with Oracle colleague Zach Brown, they drafted the initial version of Btrfs.
Thanks to corporate backing and a team of experienced developers, Btrfs moved through an aggressive development cycle. Within two years of the technical proposal, a working 1.0 version of Btrfs was released in late 2008.
Shortly after its introduction, Btrfs was merged into the mainline Linux kernel. Despite the conservative nature of file system adoption—where admins, systems engineers, and software engineers prefer proven, stable systems—Btrfs quickly gained traction.
In 2015, SUSE Linux Enterprise Server (SLES) became the first major Linux distribution to adopt Btrfs as its default file system, citing it as the future of Linux storage solutions.
Today, Btrfs is the default file system for several major enterprise Linux distributions, including SUSE, Fujitsu Linux, Ubuntu, Oracle Linux, and popular user distributions like Fedora, Arch, and Gentoo.
In fact, Meta (formerly Facebook) uses Btrfs to manage their large, dynamic data sets. According to core developer Josef Bacik, using Btrfs at Meta has significantly reduced access times and contributed to cost reductions in production environments.3
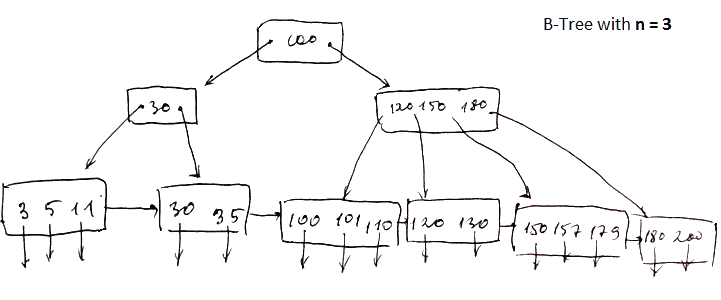
At its core, Btrfs relies on a B-tree, a type of data structure designed to organize and store data efficiently.
Here is a basic diagram of a B-tree, though in file systems, it gets more complex:
A B-tree consists of nodes and links (sometimes referred to as keys and pointers or leaves and branches), which drastically reduce seek time. This ensures that, no matter how much data you store, finding the right file is quick and doesn’t require searching through everything.
The root node is a type of index stored in a fixed location on the disk. It serves as the starting point for a rapid search called fanning out.
This structure reduces disk access time and, in turn, improves overall system efficiency. The relationship between the depth of nodes and the breadth of data is known as the fan-out factor. Tuning this ratio can either speed up searches (with a wider spread) or reduce write size for smaller segments.
Copy-on-Write (COW) is a method where data and metadata are not overwritten in place. Instead, they are copied to a new location before the update is finalized. Btrfs employs COW in conjunction with its B-tree algorithm to maintain data integrity.
Btrfs also uses delayed allocation, where metadata is updated first, linking it to new data before the actual data is copied Persistant Pre Allocation to a new location. This delay allows the file system to organize sector placement called Extent Base Allocation and optimize metadata before the actual write Multi-Block Allocation, reducing unnecessary reads and writes.
This delayed allocation process supports wear leveling (also known as TRIM) on SSDs, where data is written to new sectors to avoid repeatedly writing to the same location, thus extending the lifespan of the drive.
Snapshots are one of Btrfs’s standout features. They use COW to create lightweight, efficient snapshots of data at any given time.
Unlike traditional Linux filesystems, which only allow snapshots of logical volumes, Btrfs can snapshot both volumes and subvolumes. This means that the entire data set—down to the subvolume level—can be efficiently snapshotted. Snapshots in Btrfs do not require duplication of data, only tracking changes made after the snapshot was taken.
Cloning in Btrfs allows you to create writeable copies of subvolumes or snapshots, which share the same data blocks until changes are made. Unlike traditional file copying, cloning doesn’t duplicate the original data, making it fast and storage-efficient. When modifications are made, only the changed blocks are copied, leaving the rest shared between the clone and the original.
This makes cloning in Btrfs ideal for use cases where multiple environments or datasets need to be derived from the same base system, without significant storage overhead.
Btrfs allows you to manage storage pools dynamically with online resizing and device management, meaning that you can expand and shrink file systems while they are mounted and in use. This flexibility helps reduce downtime and allows systems to scale easily with growing storage needs.
You can add new disks to a Btrfs file system without stopping the system. With a simple command, Btrfs integrates the new storage into the existing pool, redistributing data across devices if necessary. This feature makes Btrfs highly scalable, especially in environments where storage demands can grow unpredictably.
Btrfs volumes can be expanded or shrunk online, without unmounting the file system. Expanding is as simple as adding more storage, while shrinking requires no special process apart from the resizing command. This dynamic resizing means you can adjust the size of your file system to suit your current storage needs.
Btrfs provides self-healing capabilities when used in a redundant RAID setup. Through data and metadata checksumming, Btrfs can detect corrupted blocks and automatically fix them using redundant copies of the data. This ensures data integrity without user intervention, particularly useful for critical data environments.
Btrfs supports transparent compression, which means files can be compressed as they are written to disk, saving space without requiring manual compression. It supports multiple algorithms like LZO, Zlib, and Zstandard (ZSTD), each with different balances of speed and compression ratio. This feature helps save storage space and can improve performance, especially when working with large datasets.
Journaling: Keeps track of changes before they are committed, helping with data recovery in case of a crash.
Extent Base Allocation: Allocates large, contiguous blocks of storage to reduce fragmentation.
Persistent Pre-allocation: Reserves space for a file at creation to prevent fragmentation and improve performance.
Delayed Allocation: Delays the allocation of disk space until data is written, optimizing space management.
Multi-block Allocation: Allocates multiple blocks at once to increase efficiency, especially for large files.
Stripe-aware Allocation: Optimizes block allocation for RAID systems by aligning data with RAID stripes.
Resizeable with resize2fs: Can be resized (grown or shrunk) using the resize2fs tool.
B-tree Balancing Algorithm - Different from XFS (COW B Tree): Uses a specific B-tree balancing algorithm for efficient file system organization and copy-on-write operations.
Copy-on-Write (COW): Writes modified data to new locations rather than overwriting existing data, preventing data corruption.
Snapshots and Clones: Creates point-in-time copies of data (snapshots) and allows for duplication (clones) without full data replication.
Built-in RAID Support: Provides native support for RAID configurations, improving data redundancy and performance.
Data and Metadata Checksumming: Ensures data integrity by verifying both data and metadata through checksums.
Self-Healing: Automatically repairs corrupted data using mirrored or parity blocks in RAID configurations.
Dynamic Subvolumes: Supports the creation of isolated subvolumes within the same file system for better data management.
Online Resizing: Allows the file system to be resized while it’s still mounted and in use.
Compression (LZO, ZLIB, ZSTD): Offers various compression algorithms to reduce storage space usage.
Deduplication: Eliminates duplicate copies of repeating data to save space.
Well I hope that has opened your eyes to the benefits of Btrfs. Researching for this article has helped me to learn some more about the subject.
If will definitely add to the article as I learn more about the subject, so consider this evergreen information 🌲
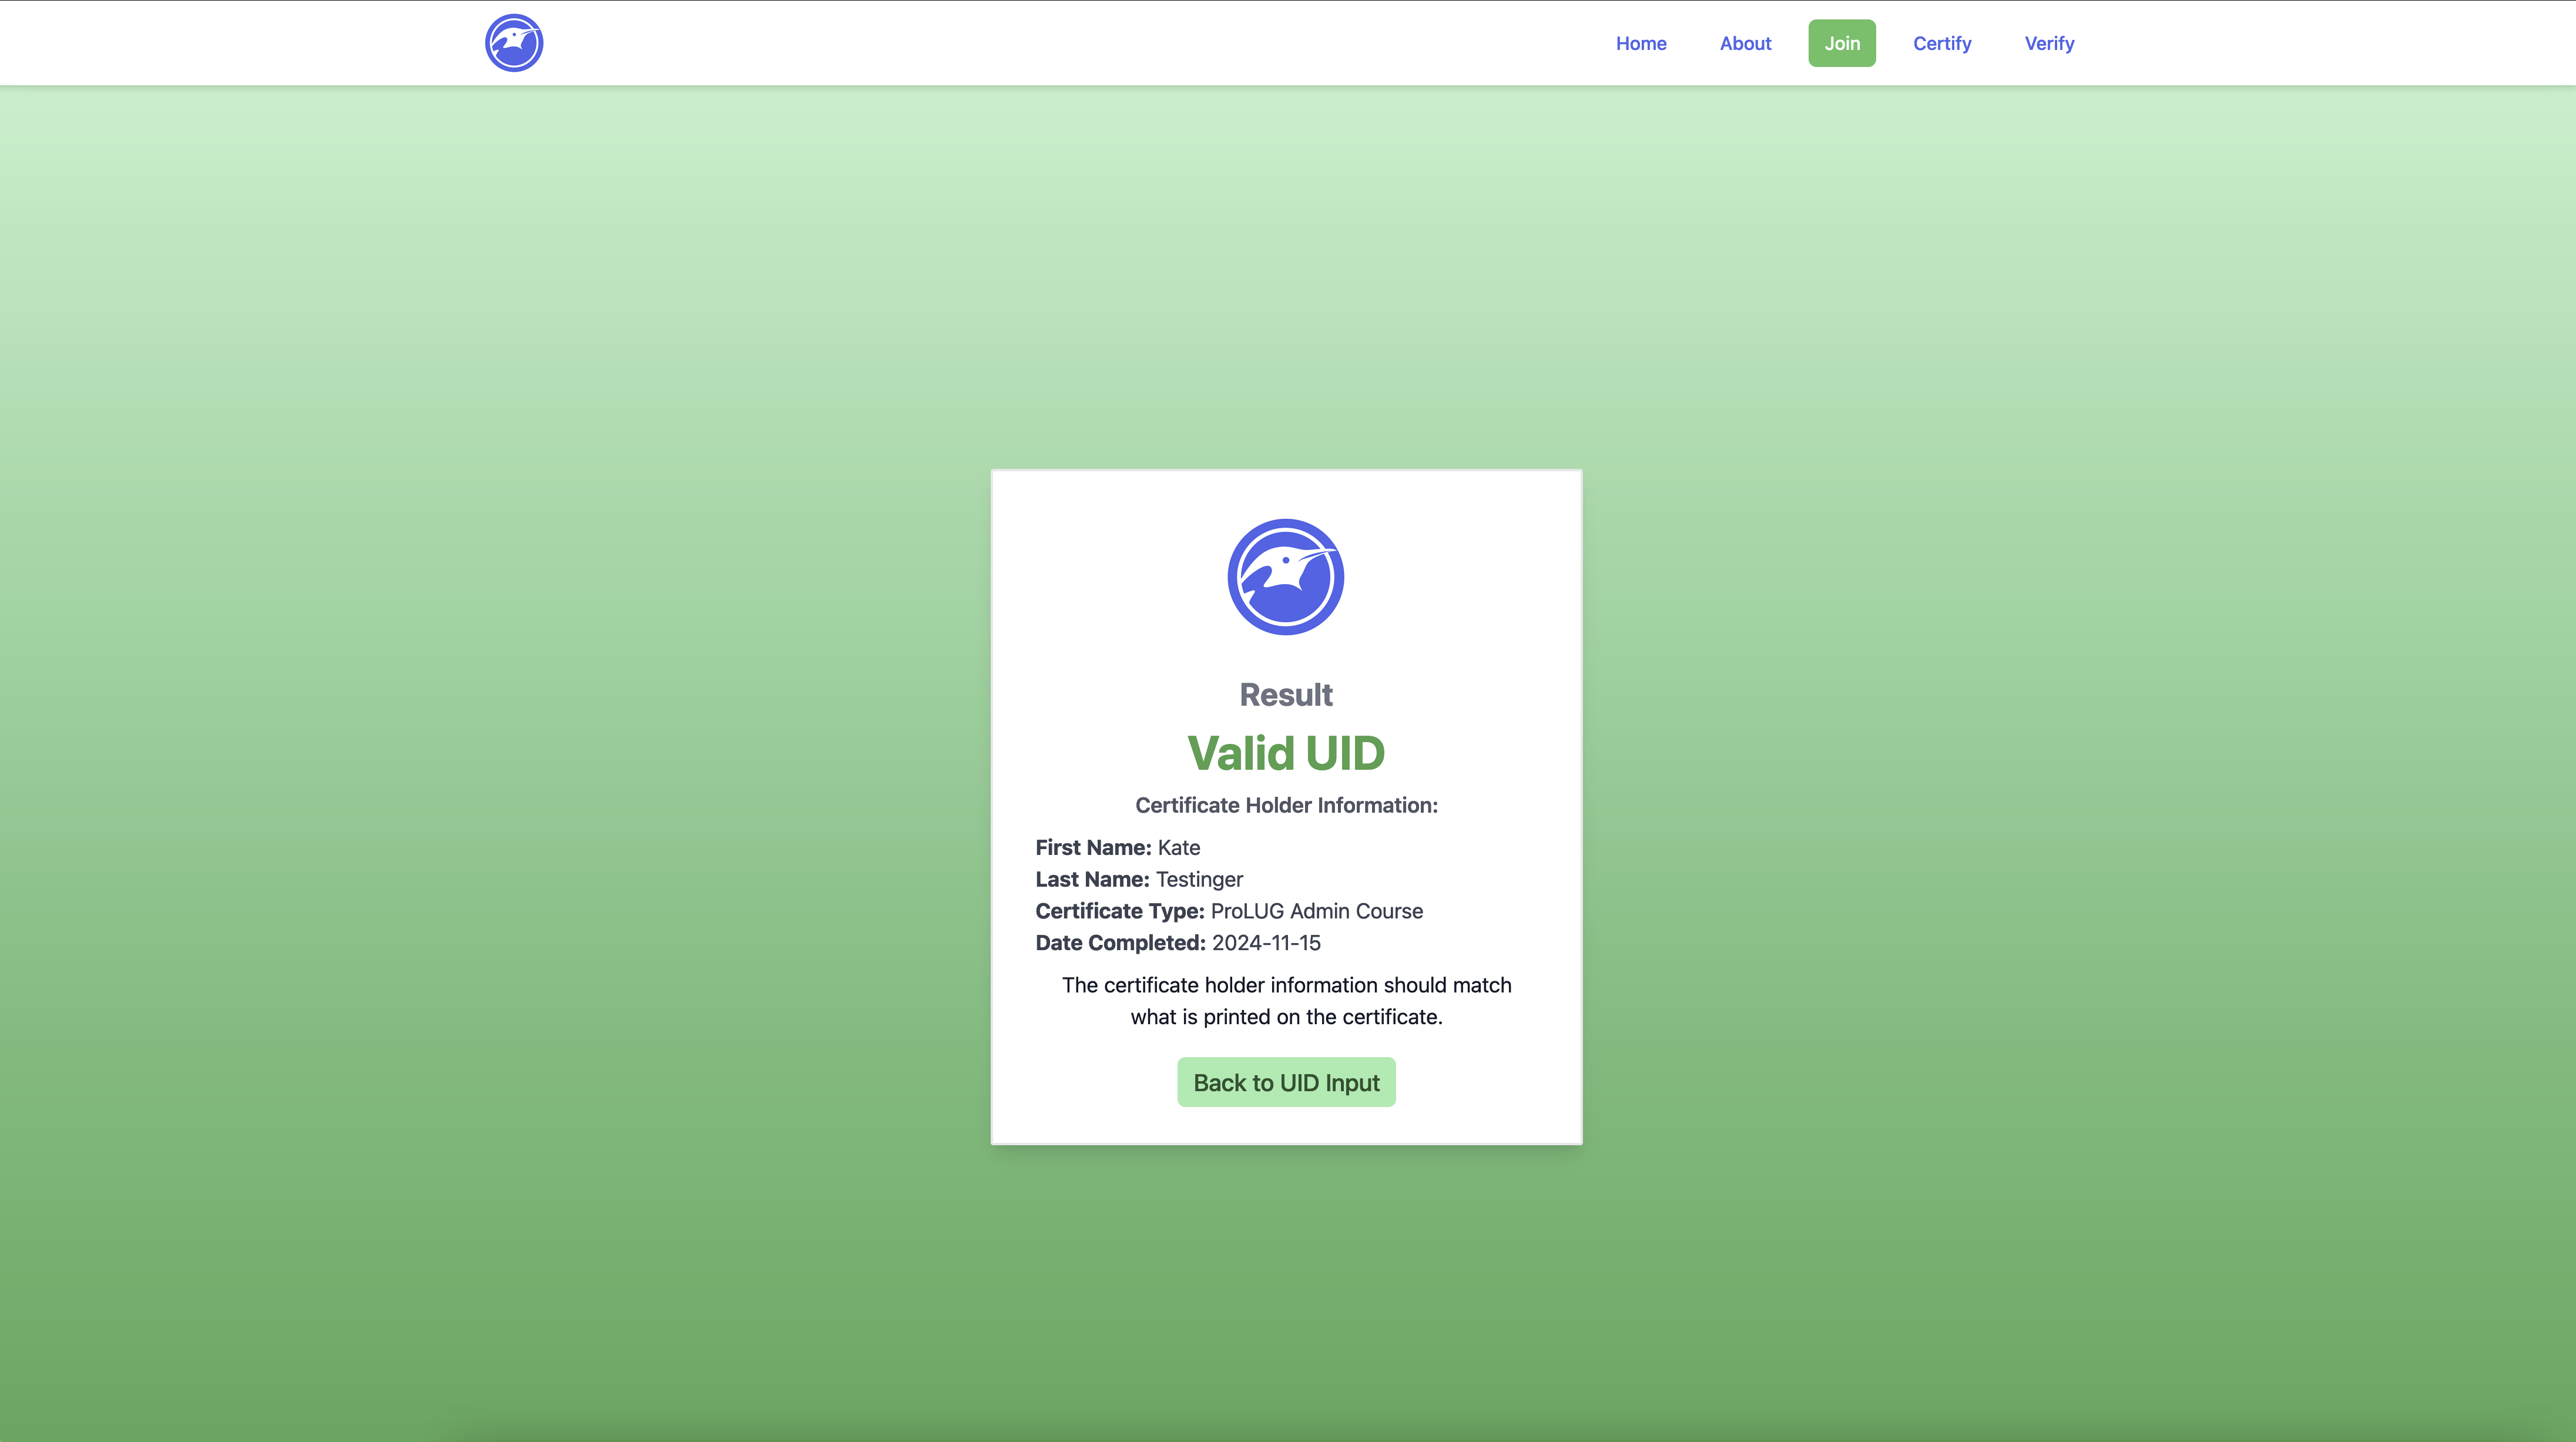
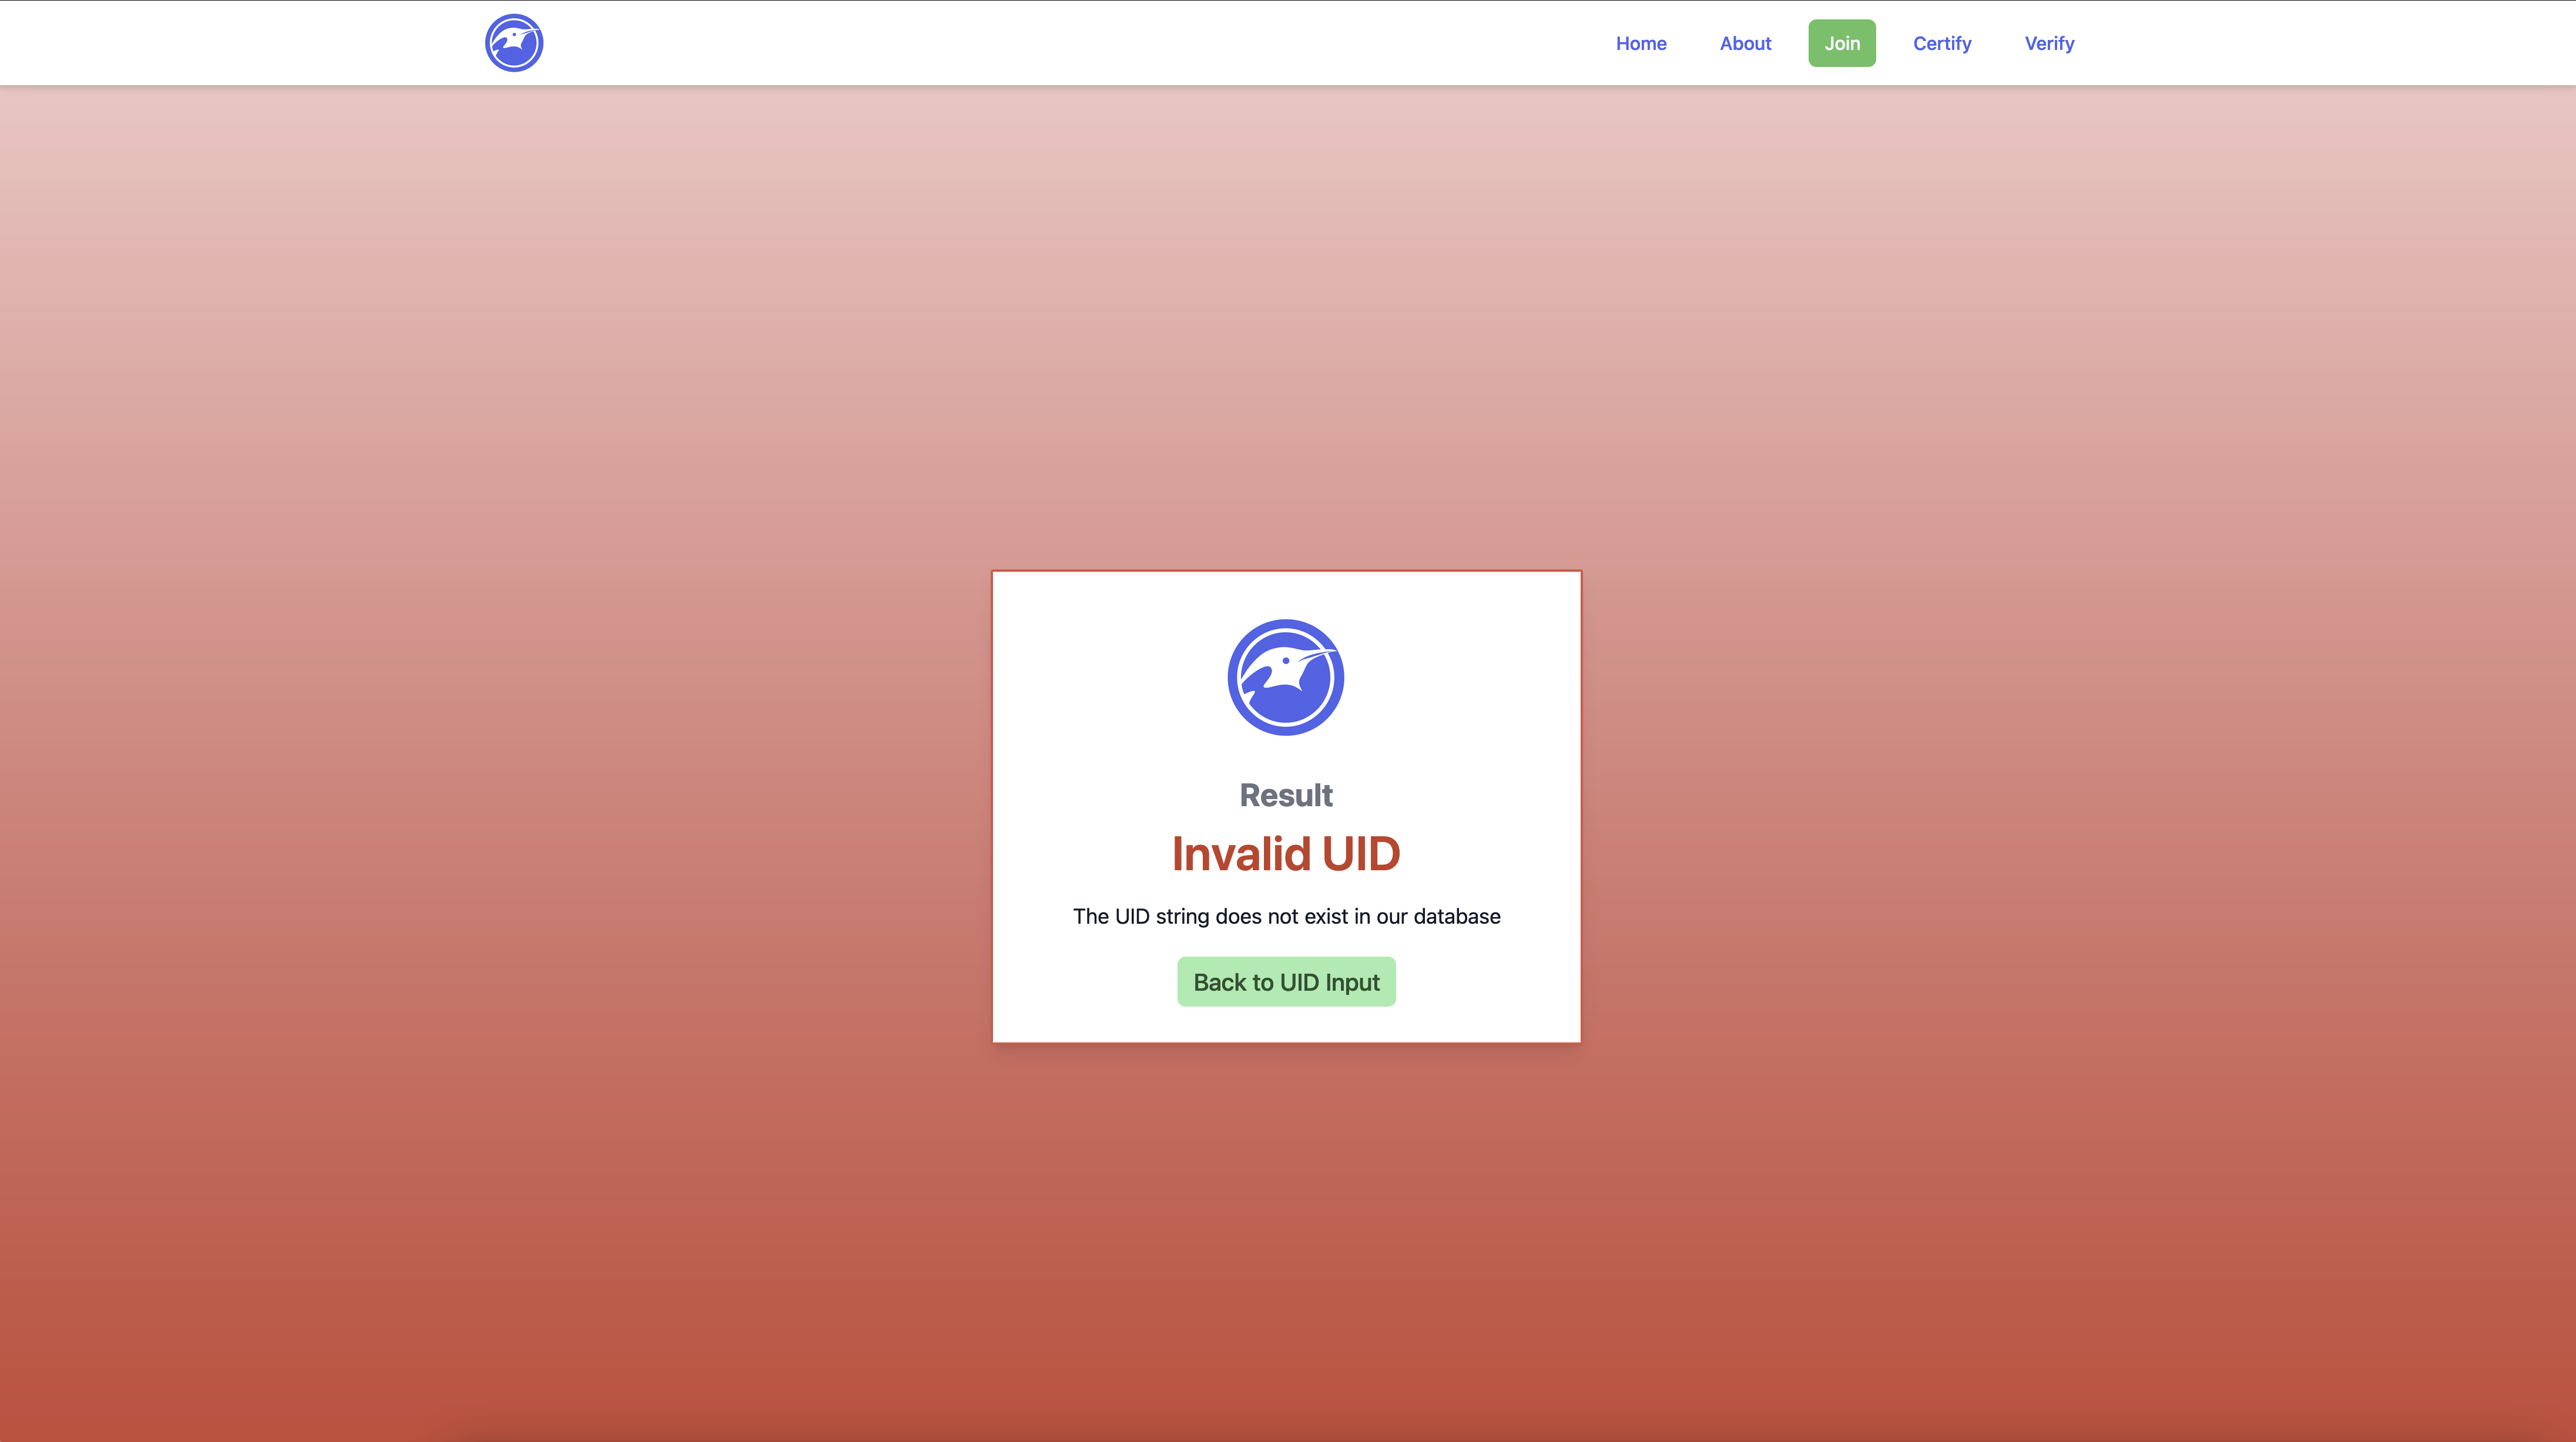
I wanted to add additional information to the site while maintaining a clean layout, predictable and comprehensible design. This is not only my personal aesthetic taste, this is a feature of accessibility. Websites with tons of information, many levels of contrast and or layouts are not only difficult for the visually impaired, but confusing for people suffering from cognitive impairment. I try to use inclusive design in accordance with WCAG guidelines on any project I am working on. So this leads me to the objective, to create a pop up design with additional information. I started with one of the more confusing features of the site, the verification input. When getting started, I wasn’t sure if it would be possible to accomplish this with TailwindCSS, so it took a bit of reading to confirm. It turns out this is completely possible using tailwind as evidence by the code snippet.
<detailsclass="open"><!-- Button to be visible --><summaryclass="bg-blue-300 rounded-xl inline-block px-4 py-2 text-xl hover:bg-blue-500 hover:duration-300 hover:text-white cursor-pointer"> ?
</summary><!-- Content will be hidden until the user clicks on the summary button. --><divclass="bg-white bg-opacity-50 backdrop-blur-md rounded-sm w-[100%] h-[100%] max-w-[600px] max-h-[700px] my-auto mx-auto absolute inset-0 text-gray-600 p-4"><h1class="text-2xl font-bold">Information</h1><divclass="m-8"><h2class="text-xl font-bold">How this works</h2><p>Each ProLUG certificate has a unique ID link. This ID belongs only to the person who earned the certificate. When the ID is checked, the certificate information should match the person’s details. </p><h2class="text-xl font-bold">Does not Match</h2><p>If the certificate information does not match what the verifier provided, the certificate is likely to be fake.</p><h2class="text-xl font-bold">Why Verify?</h2><p>ProLUG values the hard work graduates put into earning their certification. We work to stop shortcuts and forgery to protect that effort.</p></div><!-- Close button positioned at the bottom and centered --><divclass="absolute bottom-4 left-1/2 transform -translate-x-1/2"><buttonclass="bg-red-500 text-white px-4 py-2 rounded-lg hover:bg-red-700"onclick="this.closest('details').removeAttribute('open');"> Close </button></div></div></details>
Ok, Week 3 / Unit 3. This week we are working on Logical Volume Management (LVM) and RAID. Fortunately I was able to listen to the entire lecture and read most of the chats which is always helpful.
cd ~ # Change Directory to Home

mkdir lvm_lab # Create a Directory called lvm_lab

cd lvm_lab # Change location into the lvm_lab directory

touch somefile # create an empty file called somefile

echo "this is a string of text" > somefile # This sends the output of echo into the file

cat somefile # concatenates and displays what is in the file

echo "this is a sting of text" > somefile # Overwrites the line with the same text

echo "this is a sting of text" > somefile

echo "this is a sting of text" > somefile

cat somefile # We are left with one line of text after repeating this action because this
action overwrites.

echo "This is a string of text" >> somefile # The double arrow is redirect append

echo "This is a string of text" >> somefile # this adds a second line

echo "This is a string of text" >> somefile # this adds a third line

cat somefile # The concatenated output would be 3 line of "This is a string of text"

echo "this is our other test text" >> somefile

echo "this is our other test text" >> somefile

echo "this is our other test text" >> somefile

cat somefile | nl # This adds numbering to each line in the file

cat somefile | nl | grep test # This does nothing as there is no text within the file that

contains the string nothing

cat somefile | grep test | nl # Also nothing

cat somefile | nl | other # Gives us our last 3 lines and associated line number

always | nl | before your grep
PV Name          /dev/sda2
VG Name          rl_localhost-live
PV Size          <31.00 GiB / not usable 3.00 MiB
Allocatable      yes (but full)
PE               4.00 MiB
Total PE         7935
Free PE          0
Allocated PE     7935
PV UUID          gMVNd5-peB1-uUX6-Rw28-4Ncb-mi1b-rDJR38
PV Name: /dev/sda2
This is the physical volume (PV) name, which indicates the device or partition that has been initialized as a physical volume for use in LVM (Logical Volume Manager).
VG Name: rl_localhost-live
This is the volume group (VG) name to which this physical volume belongs. A volume group is a collection of physical volumes that create a pool of storage space from which logical volumes (LVs) are allocated.
PV Size: <31.00 GiB / not usable 3.00 MiB
The size of the physical volume is 31.00 GiB, but 3.00 MiB is not usable, likely due to overhead or alignment issues within the physical volume.
Allocatable: yes (but full)
This indicates whether the physical volume is available for allocation into logical volumes. It is set to “yes,” but the “full” remark means that all available physical extents (PEs) are already allocated.
PE Size: 4.00 MiB
This shows the size of a physical extent (PE), which is the smallest chunk of data that LVM manages. In this case, each PE is 4.00 MiB.
Total PE: 7935
The total number of physical extents on this physical volume. This is calculated based on the size of the physical volume and the size of each PE.
Free PE: 0
This shows the number of free physical extents on the physical volume. In this case, there are no free extents left, meaning all available space has been allocated.
Allocated PE: 7935
The number of allocated physical extents, which are being used by logical volumes. Since all available extents are allocated, this number matches the total number of PEs.
PV UUID: gMVNd5-peB1-uUX6-Rw28-4Ncb-mi1b-rDJR38
The unique identifier for this physical volume, which is used internally by LVM to track physical volumes across different systems or reboots.
  --- Volume group ---
  VG Name               vg_data
  System ID
  Format                lvm2
  VG Status             resizable
  MAX LV                0
  Cur LV                2
  Open LV               2
  Max PV                0
  Cur PV                2
  Act PV                2
  VG Size               99.99 GiB
  PE Size               4.00 MiB
  Total PE              25599
  Alloc PE / Size       12800 / 50.00 GiB
  Free  PE / Size       12799 / 49.99 GiB
  VG UUID               hFwi0D-GTlv-NFjp-O2he-x8Yw-kfIa-c3QqX6
  --- Logical volume ---
LV Path                /dev/vg_data/lv_backup
LV Name                lv_backup
VG Name                vg_data
LV UUID                B1q8Iq-0tWz-Fk0P-xwQ7-0T5T-QC3c-XcK5T1
LV Write Access        read/write
LV Creation host, time hostname, 2024-10-08 12:00:00 +0000
LV Status              available
# open                 1
LV Size                50.00 GiB
Current LE             12800
Segments               1
Allocation             inherit
Read ahead sectors     auto
- currently set to     256
Block device           253:2
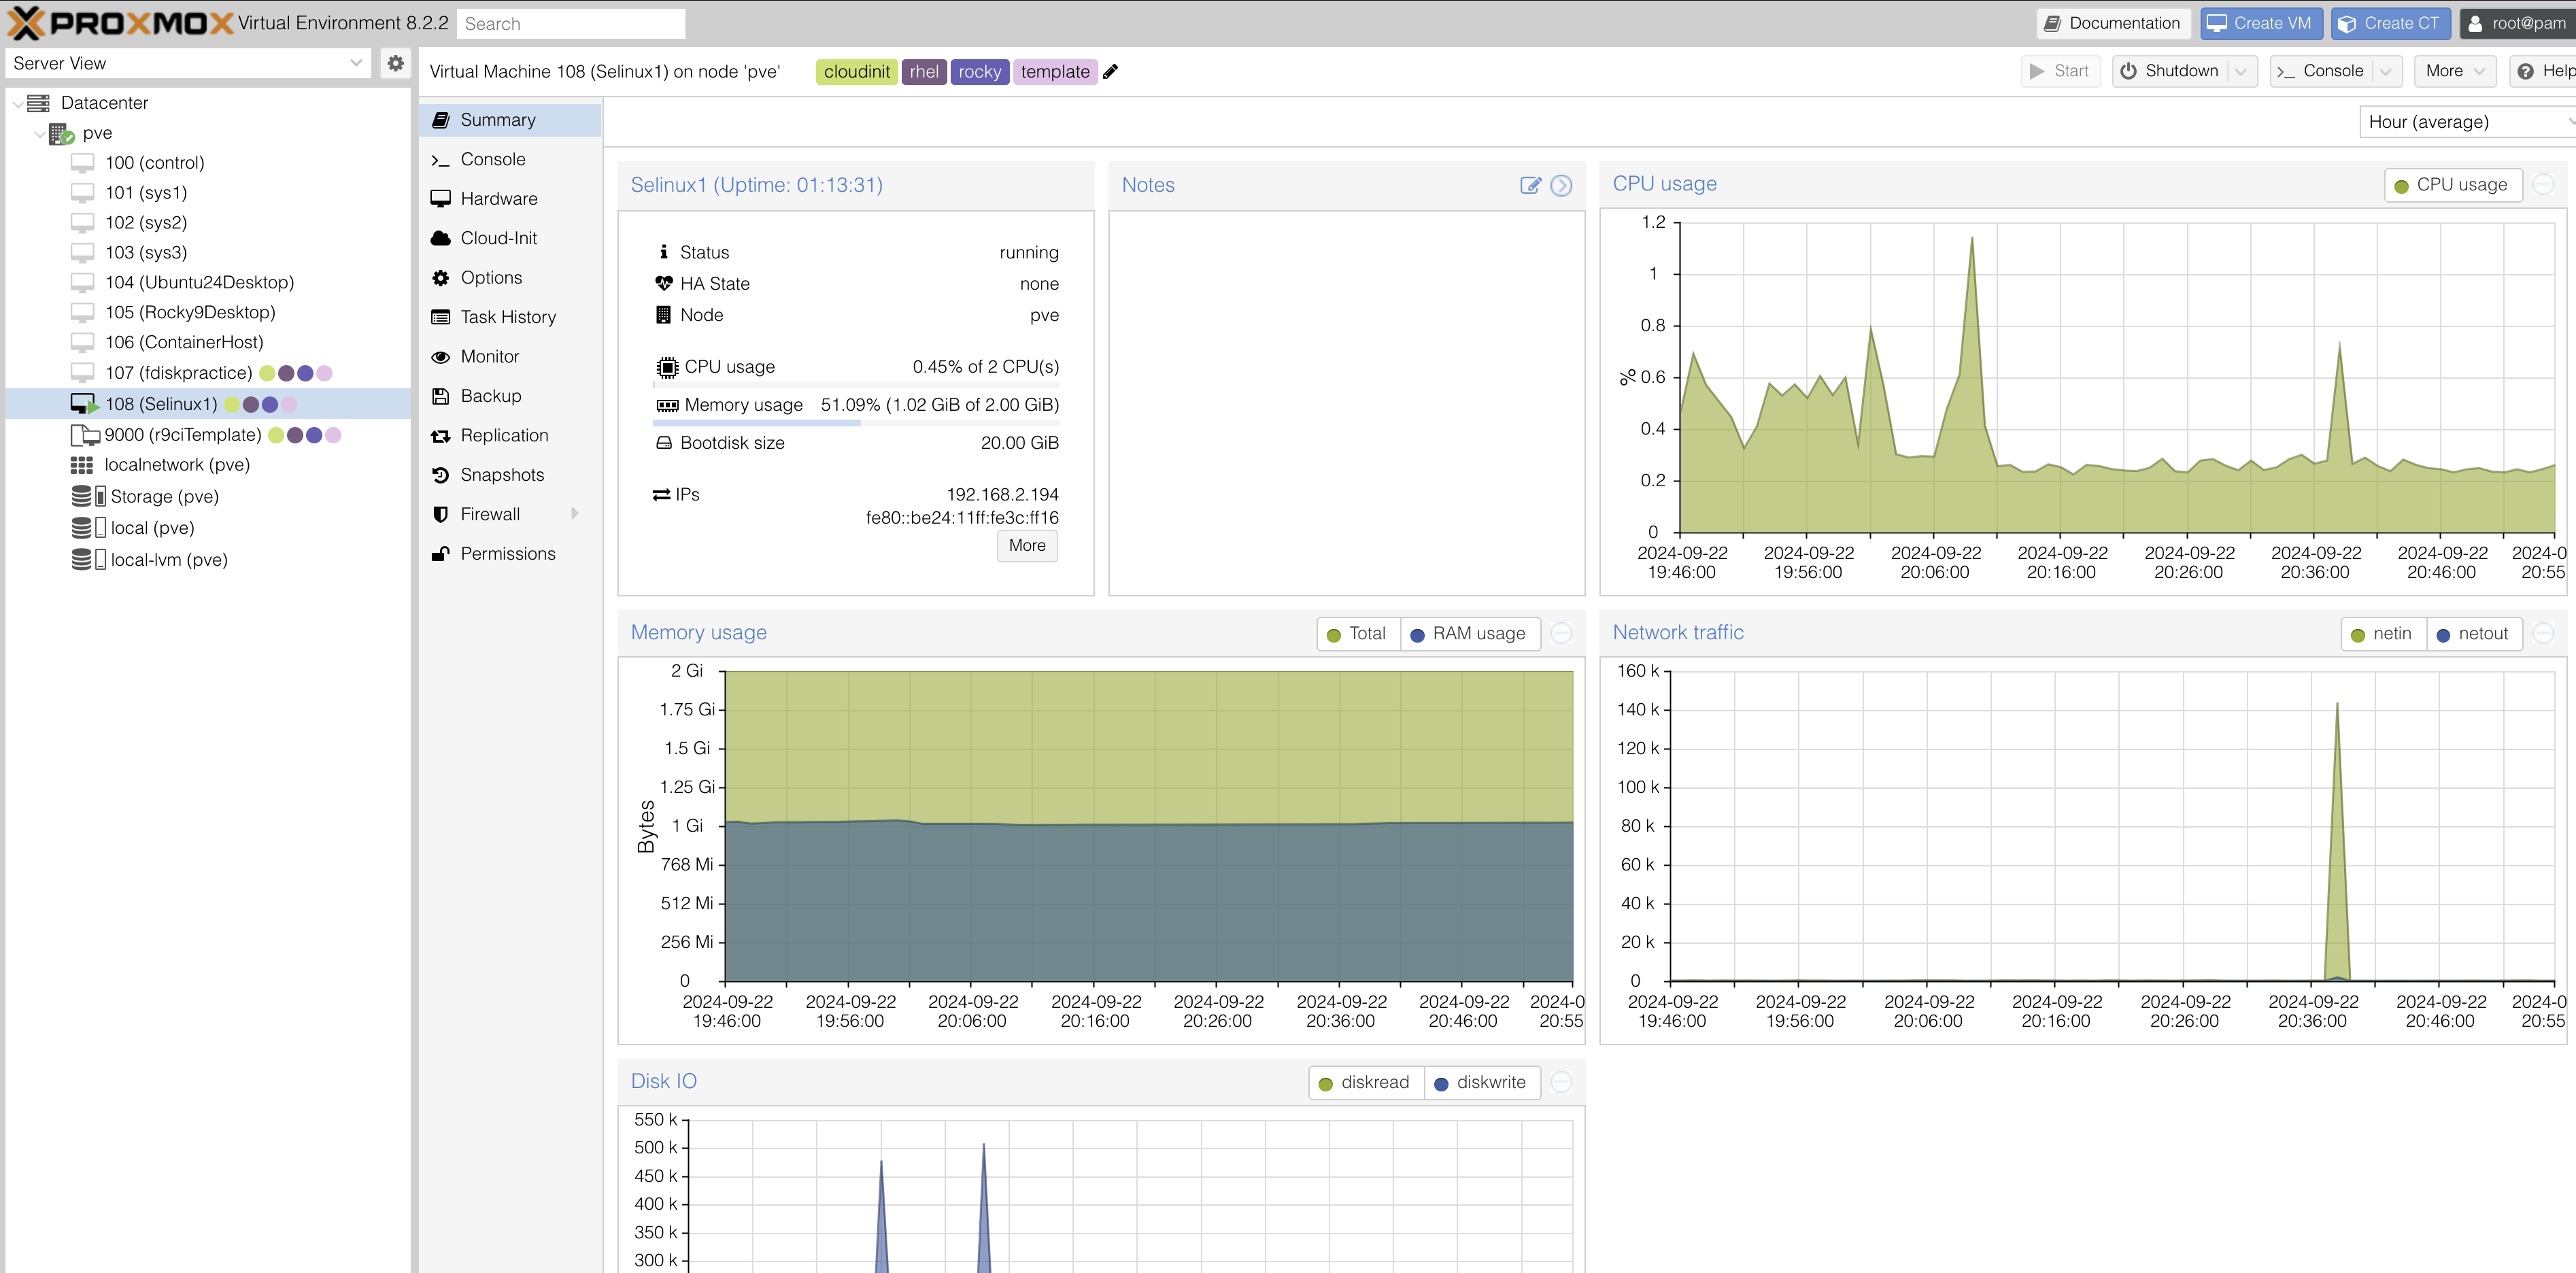
So I ran into several hurdles when putting this into practice with Proxmox.
📍 Since I was using Proxmox the storage was already an LVM on account of it being a virtualized disk
Solution: I created a second storage volume in addition to sda, sdb was emulated as an SSD and RAW storage. Once this was set up I was able to initialize the process.
📍 The demonstration lab suggested using /dev/xvd$disk the ‘x’ relates to xcp-ng, a virtualization technology that differs from mine. I am using KVM and VirtIO on Proxmox so the naming convention would differ. so vdb would be a naming convention akin to this system.
Ultimately, once I created this RAW SSD emulated storage I was able to move on.
Thanks to putting our heads together in a studygroup, I was able to get through the completed process several times. I ended carving of a Volume Group into Logical Volumes. Some of which were formatted in Ext4 and some were formatted to XFS using MKFS. 😁
The process was a little bit long with many tangential learning, ultimately I think this experience has deeply ingrained the process in my psyche, pushing out childhood memories of finger painting.
Logical Volume Summary provides a summary as the name implies of all logical volumes present in the system. I wish I had known this command earlier as I was using the other commands listed above 😄
this past Saturday. During that lecture I had a major awakening in regards to how unix works. I have heard the ’everything is a file’ mantra on several occasions. However, sometimes hearing is not fully understanding. My moment of understanding came when we checked running processes and opened one as a file. I knew that everything under the hood was a file, but ephemeral things like processes were not part of the picture. That truly blew my mind 🤯
It turns out that logical volumes are assigned UUIDs. UUIDs are unique strings that can be used to reference or link reliably to storage device. So logical volumes attain the same respect as physical volume.
Logical Volumes (LVs) offer a flexible way to manage disk storage in Linux. With LVs, users can create, resize, and move storage volumes without being limited by the physical layout of the disks. The Logical Volume Manager (LVM) abstracts the underlying physical storage, making it easier to manage disk space, support snapshots, and resize volumes as needed.
Physical Volumes (PV): These are the actual physical storage devices, like SSDs or HDDs. A Physical Volume can either be part of a Volume Group or encompass an entire Volume Group.
Volume Groups (VG): VGs are containers that hold one or more Logical Volumes. A Volume Group can span across multiple Physical Volumes, providing a flexible pool of storage.
Logical Volumes (LV): LVs are sections of a Volume Group that serve as the actual storage units. A Volume Group can contain many Logical Volumes of different sizes.
File Systems: Finally, file systems are placed on the Logical Volumes to store data.
The table below illustrates how a Volume Group (VG) can host several Logical Volumes (LVs) of varying sizes. Each Logical Volume is assigned a unique identifier (UUID), and snapshots are also given their own UUIDs.
VG
LV
FS
Size
UUID Short
Snapshot
Snapshot UUID Short
vg_data
lv_root
XFS
50 GB
f4d1-91e5-bb37
None
N/A
vg_data
lv_home
XFS
100 GB
a123-c567-8901
snap_home
abcd-ef56-7890
vg_data
lv_var
ext4
20 GB
c9d8-89e0-f9a1
None
N/A
vg_data
lv_backup
ext4
150 GB
f129-bc97-f134
snap_backup
f7d8-a67e-f765
vg_data
lv_logs
XFS
10 GB
e123-9abc-e1d4
None
N/A
vg_storage
lv_media
ext4
200 GB
bc97-bc9e-5612
snap_media
d98f-9e67-1cd2
I understand that this course focuses on the two most popular and reliable file systems, as these are the ones most commonly encountered in enterprise environments. However, I’ve noticed that BTRFs is starting to gain traction. I’ve listened to several talks and read extensively about its features and potential.
Both ext4 and XFS subvolumes can handle a lot of scenarios. This includes online resizing. This is when the size of an LVM must be increased while actively in use (Online). However, for both of these filesystems, online resizing can only grow and LVM and not shrink. Additionally snapshots must be managed on a per LV basis, not a huge issue with the advent of automation tools.
RAID stands for Redundant Array of Independent Disks (originally Redundant Array of Inexpensive Disks). It is a data storage technology that combines multiple physical disk drives into a single logical unit to improve performance, increase capacity, or provide redundancy to protect data against drive failures.
is running as a general task through the CPU. With multi-core/thread processors and more robust process handling, software RAID is more reliable than in the past.
Advantages:
Application specific hardware like a RAID Controller always has the potential to be more performant and reliable. But this is mfg. dependent, the good ones tend to be expensive (such as life) 💸
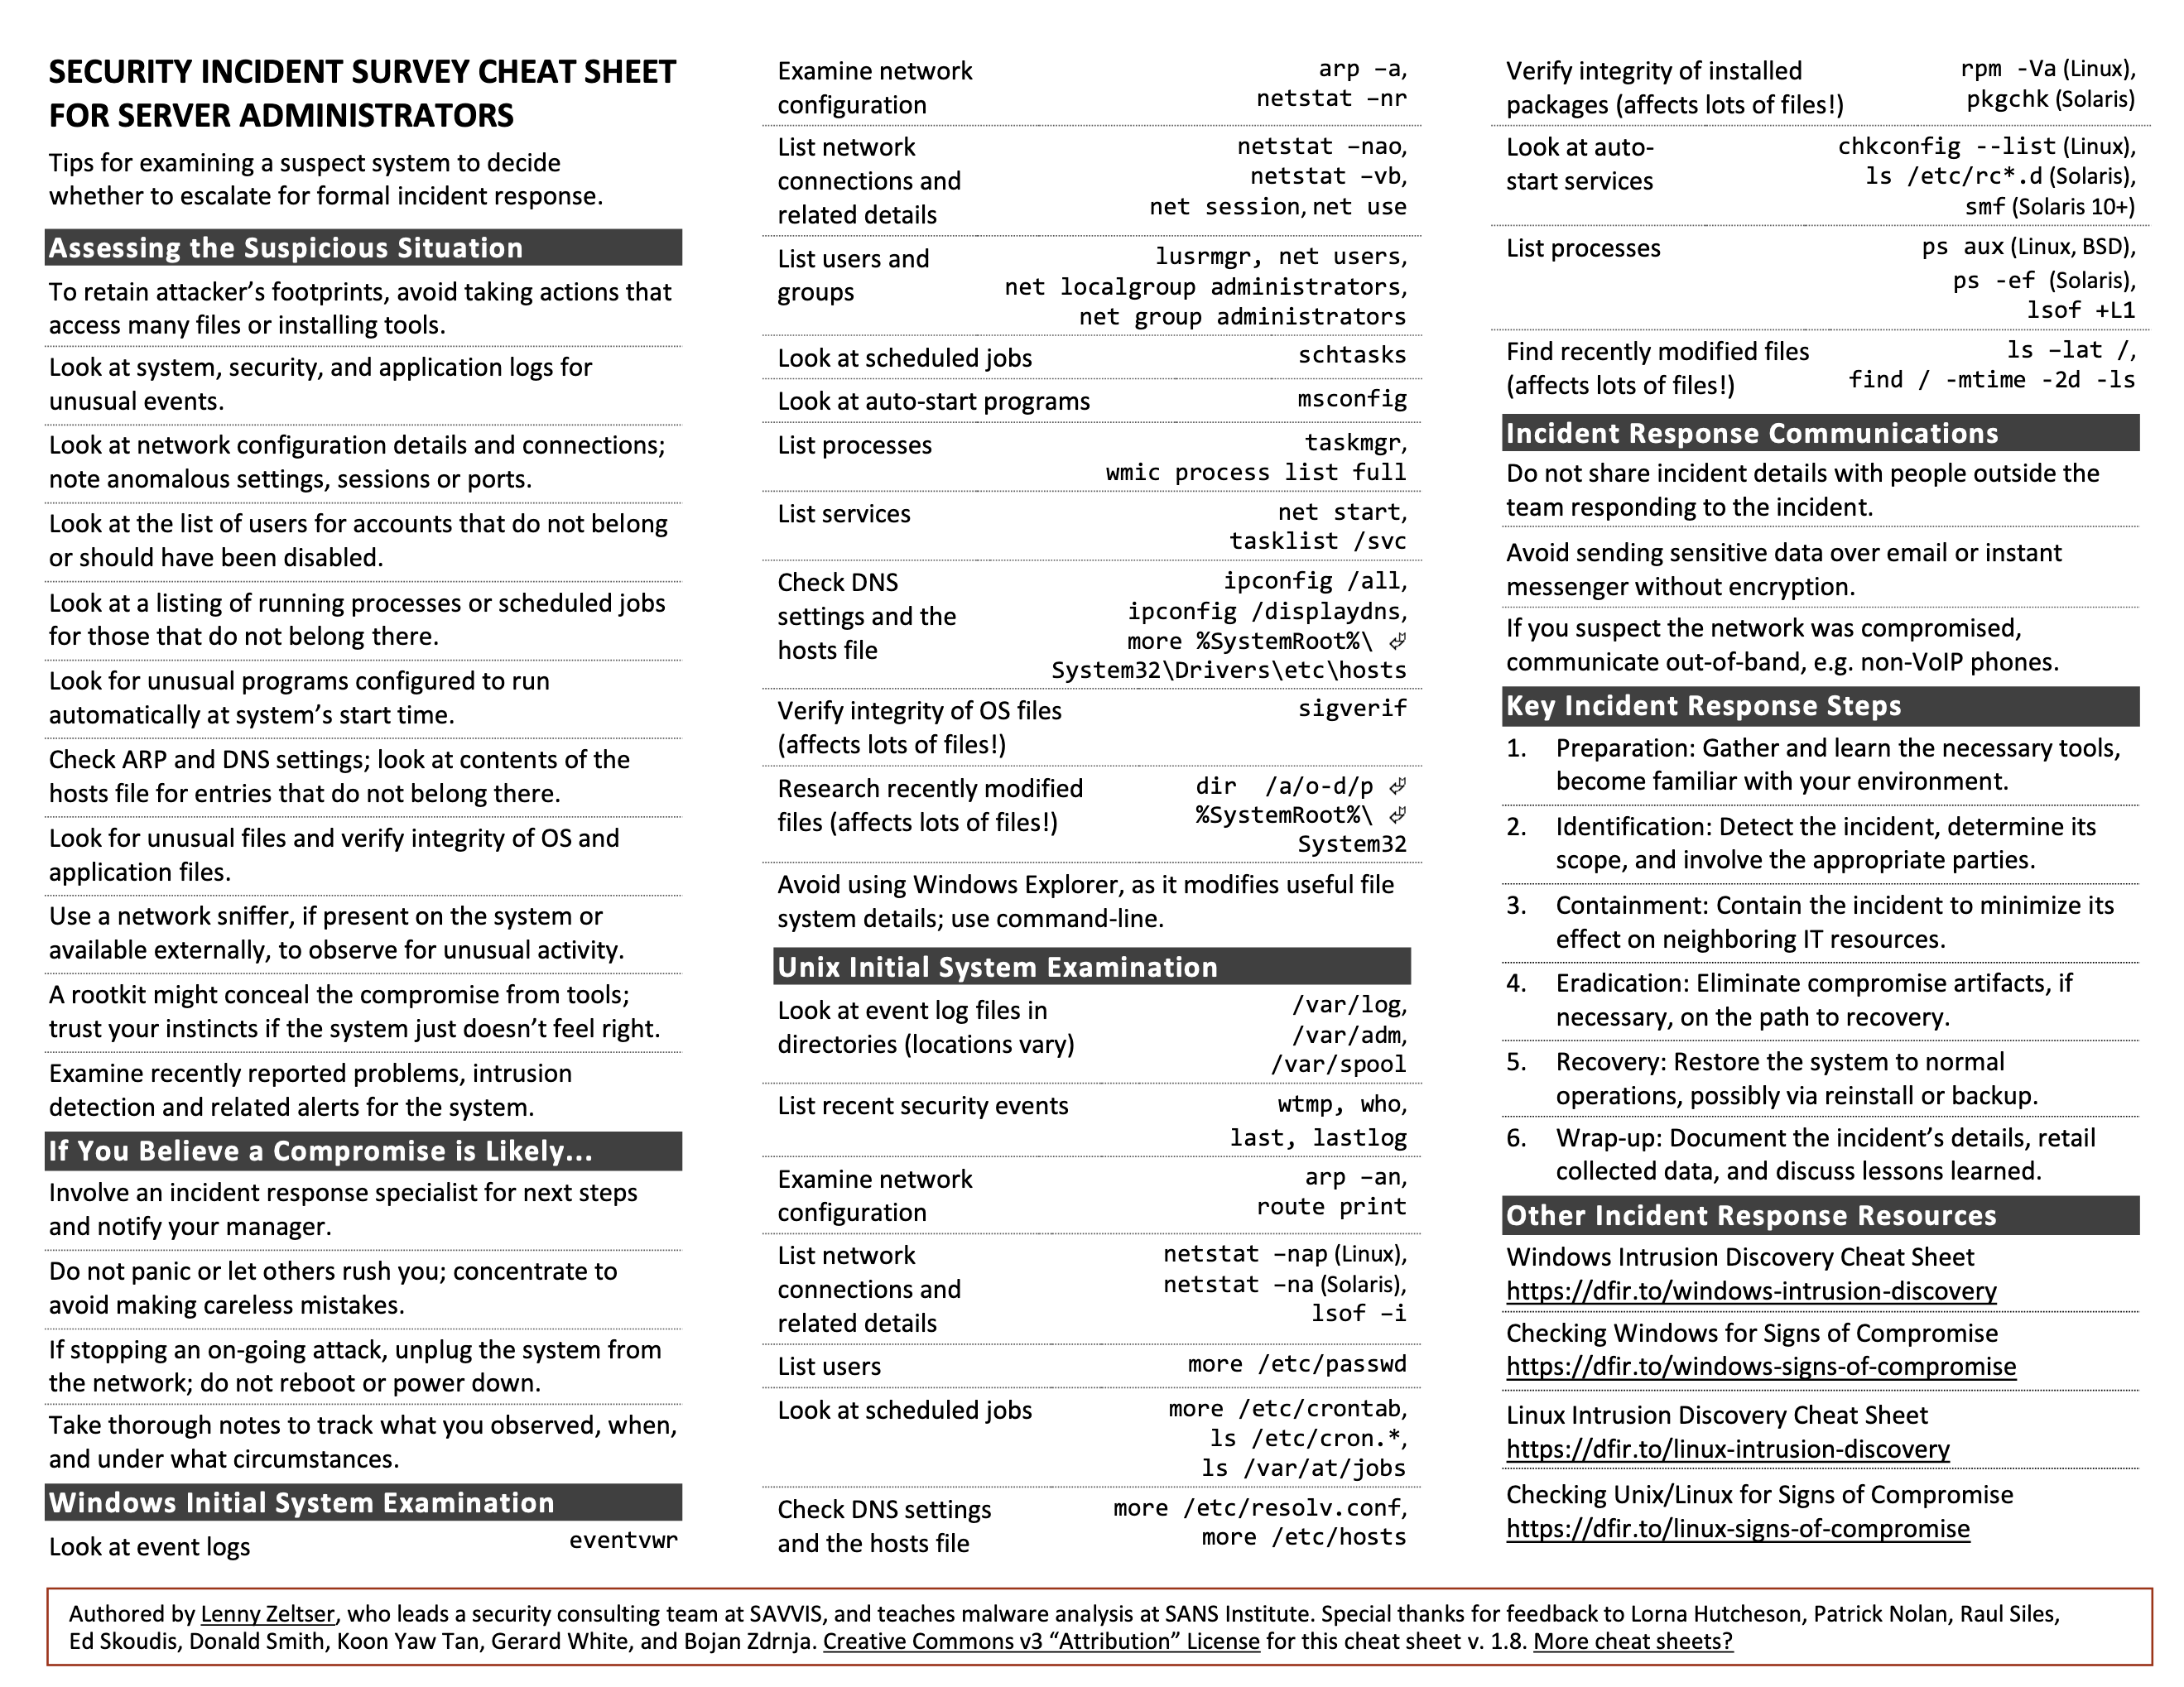
I read a chapter from googles security handbook focused on responding to a security incident.
This chapter covers a wide range of information including common mistakes, templates etcc… Scott has asked us to pull keywords that may help us better triage an incident. I decided to extend this to creating an incident response checklist for future reference. This order of the list slightly differs from that of the article, yet I think it summarizes the chapter well.
Effective crisis management requires taking command and maintaining control of an incident. The outcome of a security incident largely depends on how well your organization prepares and responds, a process referred to as incident response (IR) capability.
Transparency is key in managing incidents, particularly in light of regulations such as GDPR and service contracts. Customers are continually pushing the boundaries for how quickly investigations must begin, progress, and be resolved. Organizations are often expected to respond to potential security problems within 24 hours or less.
As the saying goes: “There are only two types of companies: those that know they’ve been compromised, and those that don’t know.”
refers to the design and implementation of systems, services, or applications to minimize downtime and ensure continuous operation.
The goal of high availability is to ensure that a system is accessible and operational for the maximum possible amount of time.
Redundancy refers to duplicating critical components or functions of a system to increase reliability. In HA systems, components like servers, databases, or networks are replicated so that if one fails, another can take over seamlessly.
Active-Active Redundancy: Multiple systems work simultaneously, and if one fails, the others continue without interruption.
Active-Passive Redundancy: A primary system works actively, while a backup system remains idle until a failure occurs.
Failover is the process of switching to a standby or backup system when the primary system fails. In HA setups, failover is often automatic to minimize disruption. Failback refers to switching back to the primary system after recovery.
Load balancing distributes network or application traffic across multiple servers to ensure that no single server becomes overwhelmed. It enhances both performance and availability by balancing the load and rerouting traffic in case of server failures.
Elastic scaling is the ability to automatically adjust resource capacity (compute, memory, etc.) based on workload demand. This is crucial for HA, as it prevents resource exhaustion during peak loads and reduces costs during low-demand periods.
Horizontal Scaling (Scaling Out): Adding more instances/servers to distribute load.
Vertical Scaling (Scaling Up): Increasing the resources of a single instance.
Auto-scaling: Automatic scaling based on real-time metrics.
In Kubernetes, elastic scaling is managed through Horizontal Pod Autoscalers (HPA), which automatically scale the number of pods in a deployment based on observed CPU utilization or other metrics. In HA systems using Kubernetes, autoscaling ensures that the right amount of resources are always allocated based on demand, contributing to both high performance and availability.
Fault tolerance refers to the system’s ability to continue operating correctly even when one or more components fail. Fault-tolerant systems detect, isolate, and handle faults without causing downtime.
A cluster is a group of servers or nodes working together as a single system to provide HA. Clustering ensures that if one node in the cluster fails, another node takes over its tasks, maintaining service availability.
In Kubernetes, a cluster consists of a set of worker machines, called nodes, that run containerized applications. Kubernetes ensures high availability by distributing workloads across multiple nodes and automatically replacing failed nodes or restarting containers.
In Warewulf, a cluster provisioning tool, high availability is addressed by enabling systems to quickly re-deploy compute nodes. Warewulf helps manage HA in high-performance computing (HPC) environments by ensuring compute nodes are readily available for workloads in case of node failure or maintenance.
Replication is the process of duplicating data across multiple storage systems or servers. In HA, replication ensures that a copy of data exists on multiple systems, so if one system fails, another can continue providing access to the same data.
Disaster recovery involves strategies to restore a system after a catastrophic failure (e.g., data center failure). DR usually includes off-site backups and failover to remote data centers.
MTTR measures how long it takes to restore a system to full functionality after a failure. Minimizing MTTR is critical for reducing downtime in HA systems.
Quorum is the minimum number of nodes or components in a distributed system that must agree or function correctly to maintain availability. Quorum is often required in cluster setups to ensure consistent operation.
Geographic redundancy involves deploying systems across multiple geographical locations or data centers. This ensures that services remain available even if a region experiences a failure (e.g., due to natural disasters or power outages).
I wanted to look at Kubernetes and Warewulf and how they relate to this topic as they are both systems written with GO and they are both well liked systems relating to HA.
I will write a future article all about GO and why it is fantastic at a later date. So I will just leave this point for now.
-A language built by the progenitors of UNIX and C for diverse connected systems.
Kubernetes 🍀:
automated failover
container orchestration
elastic scaling with Horizontal Pod Autoscalers
and geographic redundancy through multi-region clusters.
Warewulf 🐺: In HPC environments, Warewulf aids in HA by managing node provisioning and monitoring the health of the compute nodes. In case of failures, Warewulf can quickly re-deploy nodes, ensuring that the overall HPC workload is minimally disrupted.
Kubernetes and Warewulf both play key roles in maintaining high availability in modern infrastructures, with Kubernetes focusing on containerized applications and Warewulf on HPC cluster management.
In today’s world, data is ingested, processed, and distributed at an unprecedented rate. To keep up, we must implement systems that operate with the same speed and frequency. The era of handling sequential tasks one at a time is over. High availability solutions such as Kubernetes, declarative infrastructure, cluster management, and stateless automation are now essential in modern IT environments.
Although some developers, administrators, and engineers express concerns about the complexity of these deployments, preferring simpler solutions, the reality is that we need to adapt to the increasing demands of data availability and security. Setting up a robust infrastructure now may have a higher initial labor cost, but it will undoubtedly reduce the risk of costly security incidents and system downtime in the future.
Kubernetes for orchestrating containerized applications across clusters
Declarative Infrastructure using Infrastructure-as-Code (IaC) for consistent and scalable deployments
Cluster Management to efficiently manage and scale distributed systems
Stateless Automation to ensure systems can self-heal and adapt quickly without human intervention
These technologies form the backbone of high availability infrastructures, designed to handle vast amounts of data without compromising performance or uptime.
To implement these solutions, organizations should:
Automate deployment processes using tools like Terraform or Ansible to ensure repeatability and reliability.
Leverage Kubernetes clusters to manage microservices architectures, enabling fast scaling and robust fault tolerance.
Adopt a declarative approach by defining infrastructure states in code, allowing easier management and version control of systems.
Utilize stateless automation to reduce system reliance on individual components, making the system more resilient to failure and able to recover without manual intervention.
By adopting these practices, companies can build resilient, secure, and scalable infrastructures that meet the demands of today’s fast-paced data environments.
As organizations become increasingly reliant on digital systems, security incidents are inevitable. Data breaches, malware attacks, and system vulnerabilities pose significant risks that can lead to costly downtime, reputational damage, and legal consequences. In this high-availability (HA) era, where uninterrupted service is critical, an effective Security Incident Response (SIR) plan is more important than ever.
For Security Incident Response to effectively complement high availability, organizations should:
Implement proactive monitoring and detection: Use tools like SIEM (Security Information and Event Management)
Prepare for containment and isolation: High availability systems should be designed with segmentation in mind
Automate incident response and failover: Automate responses to specific types of threats, such as deploying firewalls, initiating backups, or failing over to standby systems.
Maintain constant communication: SIR teams should work closely with HA engineers to ensure that any security measures (e.g., shutting down affected systems) do not inadvertently cause a service disruption.
Review and test regularly: Just as HA systems undergo regular testing for failovers, security incident response plans should be tested in simulated scenarios.
Service Level Objectives (SLOs) are specific, measurable targets 📊 that define the expected performance or quality level of a service, typically included in Service Level Agreements (SLAs). They help ensure services meet customer expectations by setting clear benchmarks for key metrics like reliability, availability, and response time.
SLOs help teams prioritize work, manage resources, and drive decisions based on real performance data. 🔧
A Service Level Indicator (SLI) is a specific, quantifiable metric 🔢 used to measure the performance of a service, often forming the foundation of SLOs.
It seemed like taking on the entire website project was a good course of action. That way I would be able to decide the layout, functionality and logic all while learning new tools and techniques.
The website uses Go on the backend to serve templates and for back-end logic. While I’ve used Go for template servers before, incorporating templated components similar to Vue.js is new to me.
The stored data must be easily manipulated by the administrator in a human readable format. With CSV, Scott would be able to amend or edit certificate holders at a glance.
As stated before GO can securely transmit backend data without many common attacks. Additionally using GIT diff feature would ensure alterations are spotted should a compromise be made.
// Certificate verification handler
// This function is the HTTP handler responsible for verifying certificates.
// It is triggered when a user accesses the relevant URL and checks for a certificate based on a hash parameter.
funccertHandler(whttp.ResponseWriter,r*http.Request){// Extract hash value from the URL query parameters.
// The hash is used to identify the certificate to verify.
hash:=r.URL.Query().Get("hash")// If no hash is provided in the query, return a "Bad Request" error.
ifhash==""{// Send an HTTP error response indicating that the hash is missing.
http.Error(w,"Hash not provided",http.StatusBadRequest)return// Exit the handler function since no hash is available.
}// Load certificates from a CSV file.
// This function attempts to retrieve all certificates stored in the "certificates.csv" file.
certificates,err:=LoadCertificates("certificates.csv")// If there's an error loading the certificates (e.g., file not found or corrupted), log the error.
iferr!=nil{// Log the error message to the server logs and return a "Server Error" to the client.
log.Printf("Error loading certificates: %v",err)http.Error(w,"Server Error",http.StatusInternalServerError)return// Exit the handler function due to the error.
}// Initialize a pointer to a Certificate struct.
// This will hold the matching certificate if a valid hash is found.
varcert*Certificate// Iterate over all loaded certificates.
// Check each certificate's hash to see if it matches the one provided in the query.
for_,c:=rangecertificates{ifc.Hash==hash{// If a matching certificate is found, assign it to the 'cert' pointer and break the loop.
cert=&cbreak}}// Render the result page using the template engine.
// Pass the certificate (or nil if not found) to the template "result.html" for display.
err=templates.ExecuteTemplate(w,"result.html",map[string]interface{}{"Certificate":cert,// Include the certificate as part of the template data.
})// If there's an error rendering the page (e.g., template not found or syntax error), log the issue.
iferr!=nil{// Log the error message to the server logs and return an "Internal Server Error" to the client.
log.Printf("Error rendering verification page: %v",err)http.Error(w,"Internal Server Error",http.StatusInternalServerError)}}
packagemain// Certificate represents a learning certificate with associated data.
typeCertificatestruct{FirstNamestringLastNamestringCertTypestringDateCompletedstringHashstring}
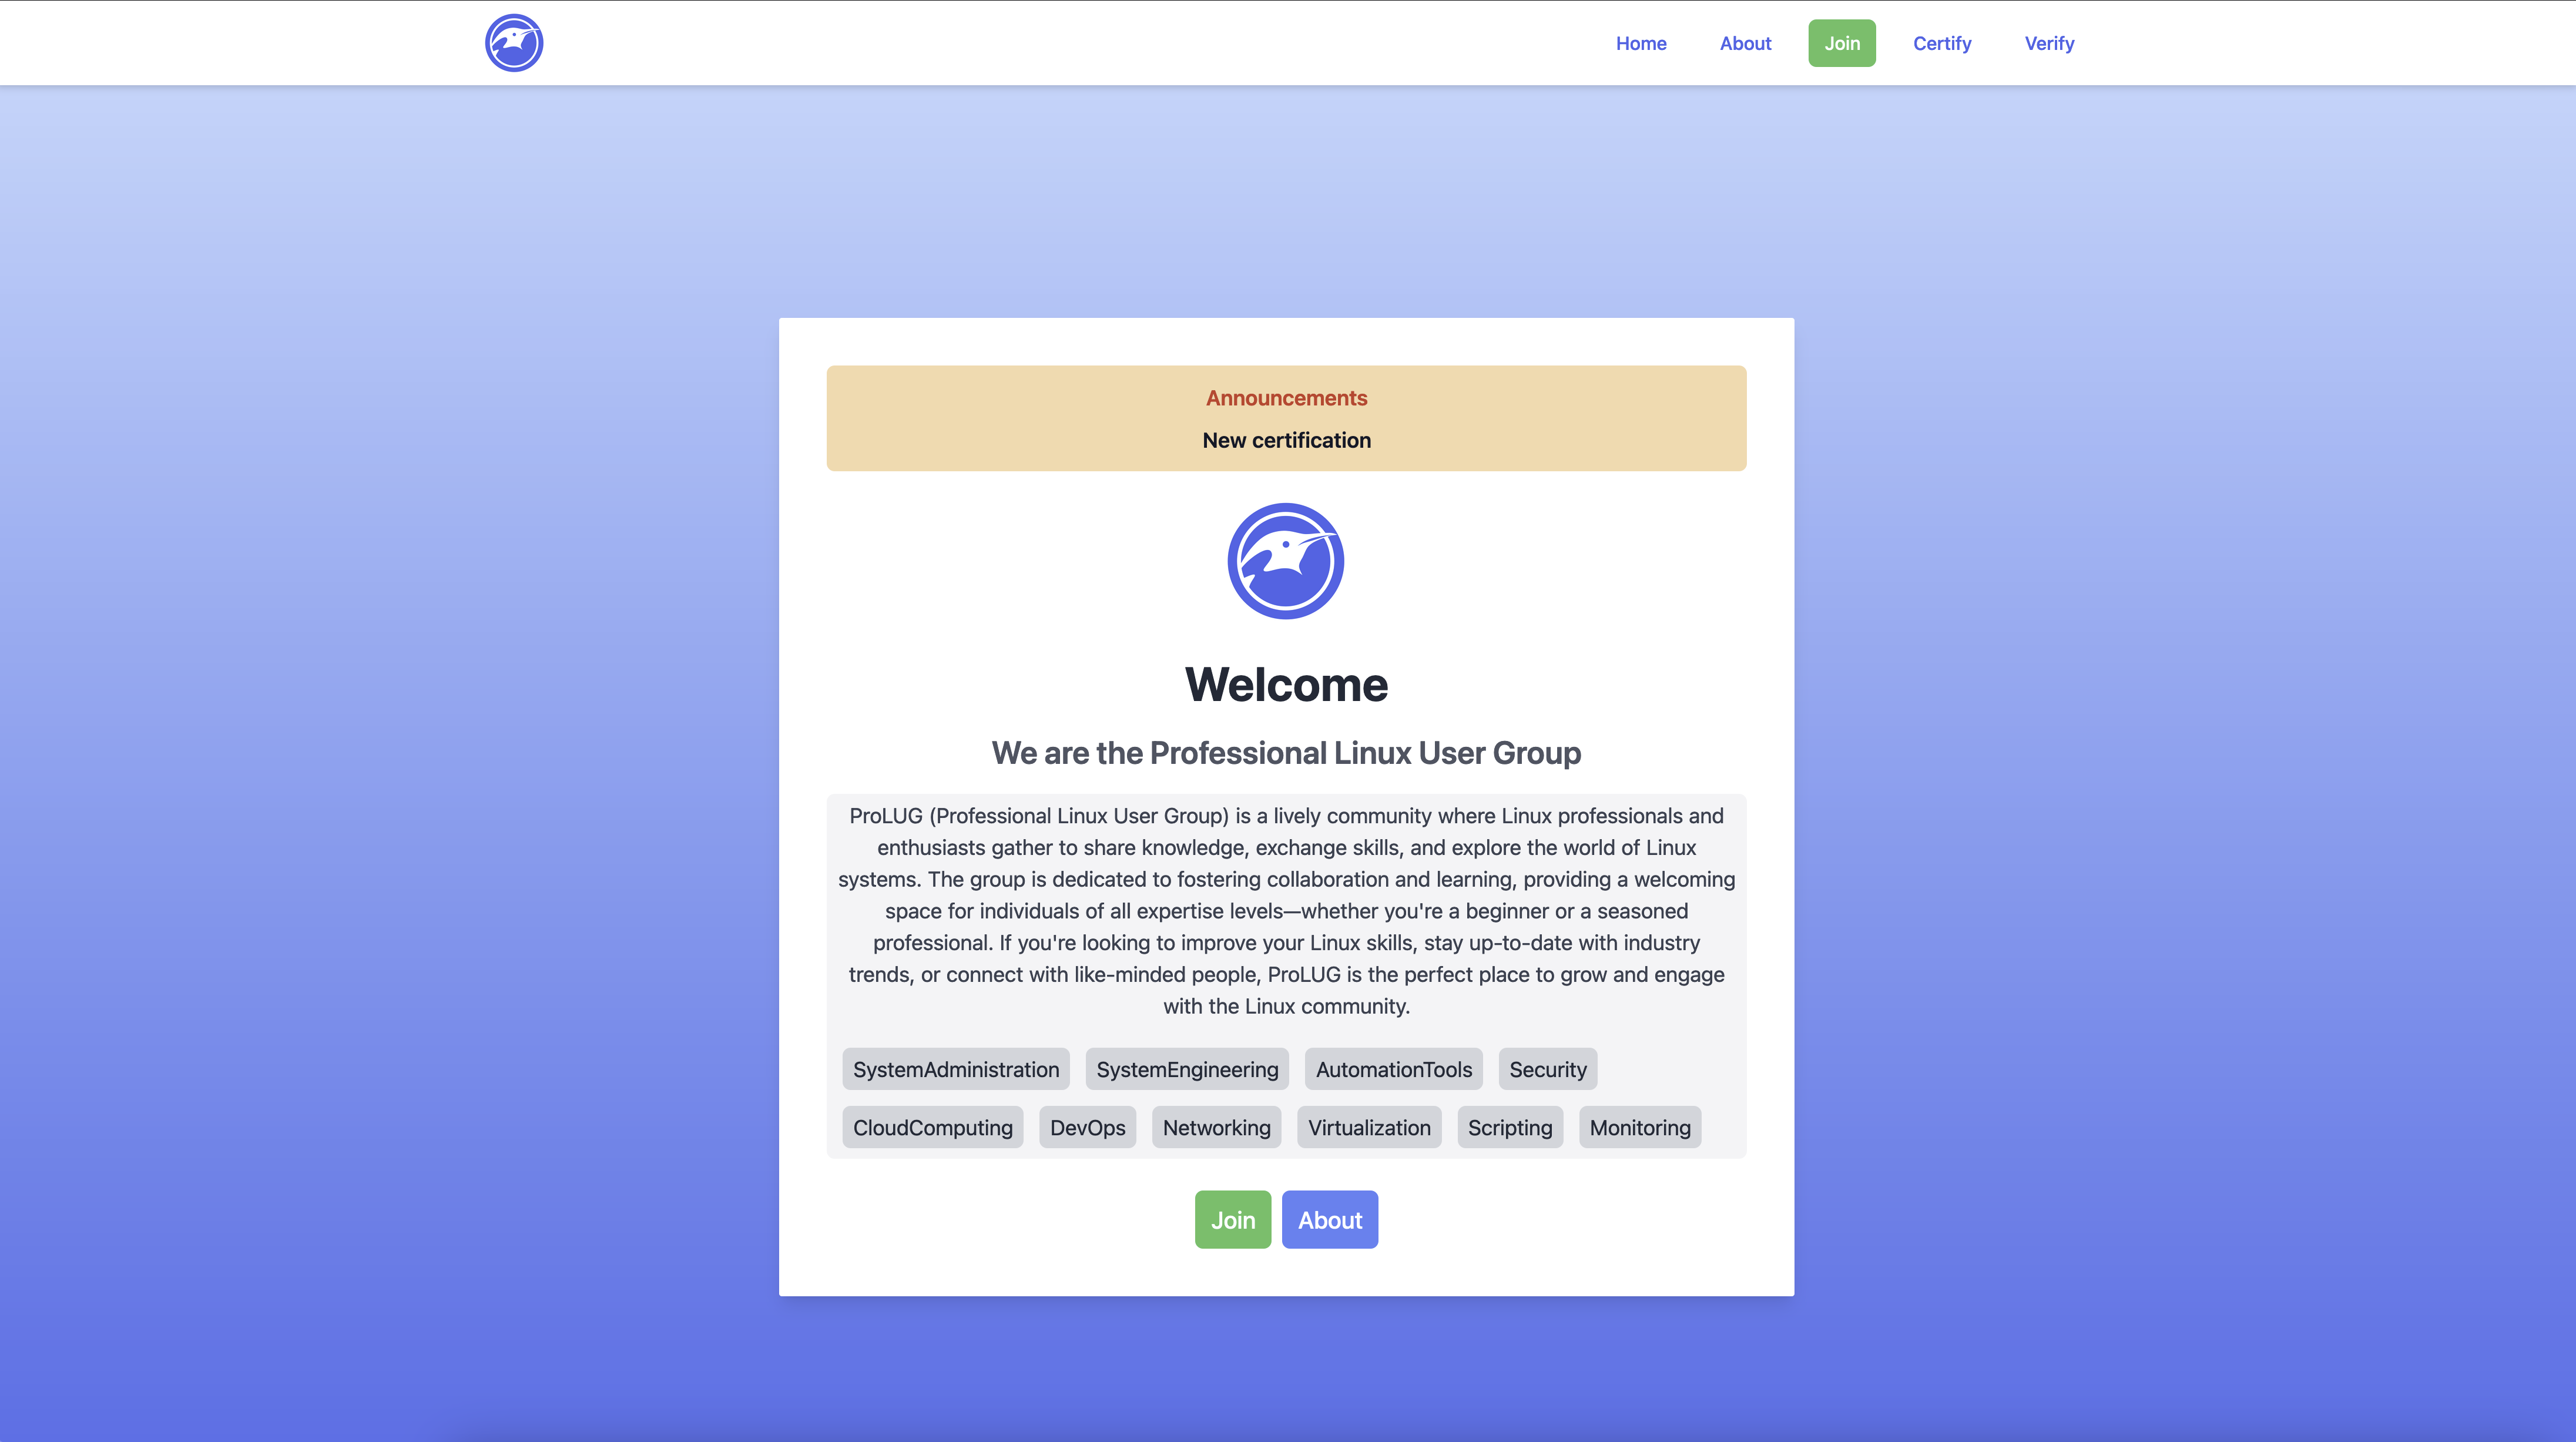
I like sites with a clean, easy to use and accessible appearance. I have a solid understanding of graphic design for accessibility and wanted to put that into practice here. So the design is stark, compact, clear and contrasting. This language carries throughout.
So as mentioned previously, I am serving html templates with GO. This can be pretty simple, we can serve a single basic html page with no modular components. I wanted to try out some fancy tricks using modularized components in this project, cutting down on the size of each template. The way this works within this project is very similar to Vue.js templating. We must declare a template as a component by encapsulating the html with tags.
for example the Navigation bar is coded similarly to any old navbar and saved in templates as navbar.html. The fancy bit is enclosing the code with the tag
We have reached the second week of the PAC and things are getting more serious. Now that we are familiar with the flow of the course and expectations are set, the second lesson has started with some momentum. 💺
I am completing the labs locally carefully covering every command listed by running them and checking output, making sure to pay attention to details like options. It was fairly time consuming, yet I learned quite a bit.
mkdir evaluation # Make Directory called ’evaluation'
mkdir evaluation/test/round6 # This fails why? We need to use the Parent option ‘-p’
mkdir -p evaluation/test/round6 # Make parent directory with subdirectories
cd evaluation # change directory to evaluation
pwd # present/print working directory = /home/ts/evaluation
touch testfile1 # create file name ’testfile1’ in current directory
ls # list = test testfile1
touch testfile{2..10} # Creates a numbered range of testfile
touch .hfile .hfile2 .hfile3 # this creates three dot files which are not visible to a normal listing method, we must use list all (ls -a)
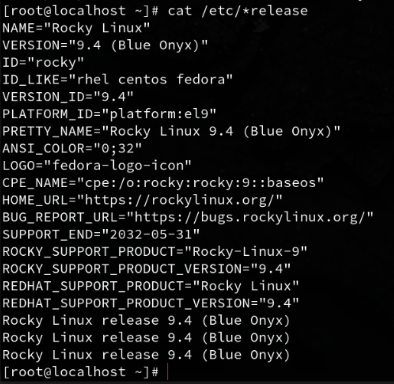
I am running Rocky Linux 9 on a local Proxmox container for this course.
hostname = localhost.localdomain
uname # system info command which stands for Unix Name
uname -a # shows a comprehensive list of system info Kernal name# Hostname, Kernel release, Kernel version, Machine hardware name, Processor type, Hardware platform, Operating system.
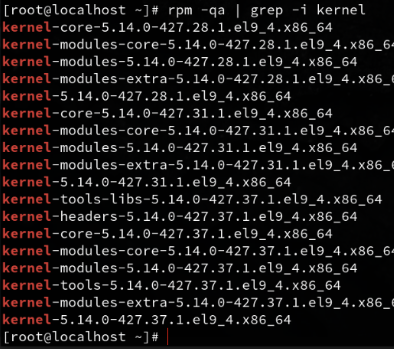
uname -r # the -r option stands for release and shows the kernel release version.
cat/proc/cpuinfo # concatenate process central processor unit information = 4 processors on my lab.
cat /proc/cpuinfo | grep proc | wc -l # what we are doing here is piping the output of the previous command to grep which is filtering lines starting with proc, then we pipe through to word count with line option to cleverly count the number of processors, the result is 4
  **`-a`**# Display disk usage for all files, not just directories.
  **`-h`**# Show disk usage in human-readable format (e.g., KB, MB, GB).
  **`-s`**# Show summary of total disk usage for a directory.
  **`-c`**# Produce a grand total at the end.
  **`-L`**# Follow symbolic links (default `du` doesn't follow symlinks).
  **`-d N`** or **`--max-depth=N`**# Limit directory depth to N levels.
  **`--time`**# Show modification time of directories.
  **`-b`**# Show disk usage in bytes.
  **`-k`**# Show disk usage in kilobytes.
  **`-m`**# Show disk usage in megabytes.
  **`--apparent-size`**# Show the apparent size instead of disk usage.
  **`-x`**# Skip directories on different file systems.
  **`--exclude=PATTERN`**# Exclude files matching a pattern.
`uptime`# Shows time in HH:MM:SS Unix time format in local time. If the time is not set, like in my instance, I get UTC 0🧐. Next, it shows how long the system has been running, the number of logged-in users, and finally, the load average over the last 1, 5, and 15 minutes.
  **`last`**# Lists all users who have logged in from latest to oldest.
  **`w`**# Lists current users and associated processes.
  **`who`**# Shows who is currently logged on. The output `pts/0` stands for pseudo terminal, typically shown when logged in remotely. It will show either an IPv4 or IPv6 address and the login time. When I logged into my Ubuntu server via SSH, I was shown the IPv6 address. 🤯
  **`whoami`**# Tells which user you are.
  **`printenv`**# Shows a long list of environmental information.
  **`printenv | grep -i home`**# Shows that I am in the home directory of `root`.
  **`id`**# Shows a lot of info about UID, GID, and group memberships, including SELinux policies.
  **`echo $SHELL`**# Displays the path of the shell environment variable, in my case, `/bin/bash`.
Run each of these commands individually for understanding:
  **`free -m`**
  **`free -m | egrep "Mem|Swap"`**
  **`free -m | egrep "Mem|Swap" | awk '{print $1, $2, $3}'`**: What are the first, second, and third columns? How would I know the variable names?
  **`free -t | egrep "Mem|Swap" | awk '{print $1 " Used Space = " ($3 / $2) * 100"%"}'`**: Similar question for these variables.
  while true; do free -m; sleep 3; done
  Watch this output for a few and then break with ctrl + c
  Try to edit this to wait for 5 seconds
  Try to add a check for uptime and date each loop with a blank line between each and 10 second wait:
  while true; do date; uptime; free -m; echo “ “; sleep 10; done
  Since we can wrap anything inside of our while statements, let’s try adding something from earlier:
  While true; do free -t | egrep "Mem|Swap" | awk '{print $1 " Used Space = " ($3 / $2) * 100"%"}'; sleep 3; done 👍
Uptime – The time a system has been running for without interruption.
Standard input - stdin ‘0’ the default stream where a program receives data.
Standard output - stdout ‘1’ refers to default stream output of a program.
Standard error – stderr ‘2’ refers to a default stream wherein an error is sent.
Week 1 went well for me. I was very excited to start this course as it strongly aligns with my professional interests, and it came at a great time. I am incredibly grateful to have access to such a talented group of like-minded and enthusiastic professionals.
I managed to complete everything for Week 1 by preparing in advance. For example, I created this blog and started some of the materials early. The night before the course began, I went through Vim Tutor and Vim Adventures to give myself a bit of a head start, as my time is currently divided between various responsibilities. I also dedicated a significant portion of my time to starting my capstone project and troubleshooting issues.
I’ve set aside 8 hours per week, as suggested by Scott, for attending lectures, reading materials, practicing labs, and doing general research. During Week 1, I used roughly 6 hours, so I believe I’ve allocated enough time to complete the course work.
My note-taking has been excellent for this course. Prior to starting, I learned how essential note-taking is to the administration and engineering process, so I began using LogSeq as my note-taking tool four months ago. This gave me time to familiarize myself with its features, allowing me to dive into the lectures fully prepared. I’m also a fast touch typist, so I can easily listen and type simultaneously. After each lecture, I review and organize my notes by nesting and tagging information to relate it to other topics. Additionally, I’ve been reflecting on everything by writing in this blog.
SELinux (Security-Enhanced Linux) is a security module integrated into the Linux kernel that enforces mandatory access control policies to provide more granular control over how processes and users interact with files and resources. By defining strict rules on what actions each program or user can perform, SELinux significantly enhances the security posture of a Linux system, helping to prevent unauthorized access and exploits.
AppArmor (Application Armor) is a Linux security module that enforces access control policies based on file paths, limiting what resources applications can access to enhance system security. It provides a simpler, profile-based alternative to SELinux, allowing administrators to create restrictive environments for individual applications without requiring deep changes to system configuration.
This article provides a brief comparison between SELinux and AppArmor regarding their effectiveness in securely separating containers.
After reading, it became clear that AppArmor is not an ideal choice for DevSecOps when it comes to securely separating containers. This is due to AppArmor’s lack of support for Multi-Category Security (MCS). MCS allows for a hierarchy of controls, granting varying levels of access.
Therefore, if you’re looking to securely separate containers without relying on Virtual Machines—which can be costly—SELinux emerges as the better option for such tasks.
By understanding these differences, it’s clear that SELinux provides a more secure framework for container separation, making it a crucial tool for modern DevSecOps workflows.
Before enabling SELinux, you can verify its current status by running the sestatus command, which provides the Security Enhanced Status of the system. To activate or configure SELinux, you need to modify the configuration file located at /etc/selinux/config. SELinux can operate in two modes:
Enforcing: SELinux policies are actively enforced, and violations are blocked.
Permissive: Policies are not enforced, but violations are logged for review, allowing for troubleshooting without blocking actions.
A context in SELinux is a set of security labels used to manage access to files, processes, and other system resources. The context is composed of several fields:
User: Represents the SELinux identity of a subject (process) or object (file).
Role: Groups privileges for processes and users, determining what they are allowed to do.
Type: Defines how subjects (processes) can interact with objects (files or resources).
Level: Used in Multi-Level Security (MLS) or Multi-Category Security (MCS) systems for additional granularity in access control.
A few weeks ago, I learned how to create uninitialized templates with Proxmox, meaning the SSH keys are generated for each copy of the template. This is done with cloud init.
So today I created a clone of my template specifically for getting hands on experience with SElinux
I opened the /etc/selinux/config and set se to enforce. I then ran sestatus to confirm selinux had been activated.
I created a new user policy for myself with semanage user -a -R ‘staff_r webadm_r’ Treasure here is the result after running semanage user -l
You follow your company instructions to add a new user to a set of 10 Linux servers.
They cannot access just one (1) of the servers.
When you review the differences in the servers you see that the server they cannot access is running SELINUX.
On checking other users have no problem getting into the system.
You find nothing in the documentation (typical) about this different system or how these users are accessing it.
What do you do? Where do you check?
From the given information, it seems likely that SELinux is denying access to the new user. To troubleshoot this, I would take the following steps:
Check SELinux User Configuration: I would run the command semanage user -l to list all SELinux users and confirm whether the new user exists within the SELinux policy.
Verify MLS/MCS Levels and Roles: If the user is already registered, I would review the user’s Multi-Level Security (MLS) or Multi-Category Security (MCS) level and verify the role assigned to the user. It’s important that the user’s role matches those that have the necessary access permissions.
Assign Appropriate Role: If the current role restricts access, I would assign the user to an SELinux role that permits access to the system, ensuring that role-based access control (RBAC) is properly configured.
Despite paying close attention, I somehow got confused by this challenge. I suppose the exercise was designed to force me to read through documentation, which was tough.
But I am proud to say that through trial and error, I was able to get through.
Administrators focus on restoring functionality to existing systems, while Engineers work on building and implementing new systems or improvements.
Administrators have existing documentation to reference for troubleshooting, whereas Engineers are responsible for creating new documentation.
Administrators can compare similar systems for inconsistencies, but Engineers may be working with entirely new systems or solutions, making such comparisons difficult.
Administrators typically deal with reactive troubleshooting, where the goal is to quickly restore functionality after an issue occurs. Engineers, on the other hand, often engage in proactive troubleshooting by identifying potential problems before they happen, ensuring that systems are scalable and sustainable.
While administrators may focus on resolving immediate operational issues, engineers are responsible for the long-term stability of systems, often troubleshooting while keeping future requirements in mind.
I have no direct application for most of this stuff at the moment. however I will definitely use scripting in my current position in order to automate tasks. Furthermore, I will def remember several commands from the labs that I will likely use daily.
Well the ProLUG course is a go. We had a great meeting yesterday with a group of over 80 people. There was a slight snafu regarding thread size limits, so mid lesson we jumped into a presenter room. The session ran for a solid two hours wherein Scott went over command line interface essentials, networking essentials, VIM, pathing, redirects, Xargs, man pages and more. Although I have decent foundational knowledge of Linux, I know that there is always something to learn or better understand. I came away from this first class with a handful of things to review and practice for sure.
Group discussions have kicked off early in #ProLUG-Projects. Scott has prompted us with a few questions for Unit 1 that we are to post and discuss. I thought it would be good to post these answers in a longer form on my blog. This acts as a review of yesterdays work and gives me a chance to further reflect.
Using this rubric, we are to self-assess our skills in various areas with a score from 1-10, giving us a total score at the end. My score was 48 out of a potential 110. I would never rate myself above a 7, as that feels like Demi-God territory!
Given the pace we started at in the first class, I’m confident that my skills will improve throughout this course. I plan to really go for it and challenge myself along the way.
I aim to gain hands-on experience in all aspects of system administration. While I have studied Linux and system administration, I understand that skill levels in this field can vary widely. As I work toward becoming a Systems Engineer, I recognize the importance of consistently challenging myself. Through this journey, I hope to build confidence in managing existing systems, configuring services, securing environments, and automating tasks.
I am looking to become a full time Linux System Engineer. I am currently in an administrative support role wherein I am tasked with setting up new systems on a small scale. I would like to be able to manage a large number of servers with automation.
Our second task is to look for a job we would like to target and list the requirements posted for that given job. I found this job posted by OERP Canada, located in Toronto, Ontario, with the following information.
The role will be 100% remote for now (#socialdistancing). Eventually, it will convert into an onsite role in Toronto, ON. We are only accepting applications from residents of Canada.
OERP Canada is looking for a full-time, experienced LINUX System Administrator to help maintain our operations and support our Odoo application deployment team, which deploys the Odoo Business Application suite for our clients. The successful candidate will have a technical background in LINUX, experience with hosting, web and proxy servers, database administration, mail routing, network security, strong communication skills, and the willingness and ability to think creatively and flexibly. A desire to learn is an important requirement of being part of our team.
This position is both creative and rigorous by nature—you need to think outside the box. We expect the candidate to be proactive and have a “get it done” spirit.
I plan to close this gap by learning more about general Linux security and networking principles from this course. Additionally, I’ve already purchased a recently published book by Michael Lucas on running and maintaining mail servers, which I intend to skim through. Additionally, I am studying ITIL to improve my understanding of technical support and service management.
Vim is a program created by the late Bram Moolenaar as an improvement to an older program called Vi. It is a modal text editor, meaning there are different modes of usage — I’ll get into that later. While strongly associated with UNIX systems, Vim is available on other platforms as well. It is used to efficiently create and modify files from a simple terminal, requiring very limited system resources. Vim is a foundational tool for mastering Linux, allowing one to navigate the directory structure and edit configuration files like no other. Furthermore, Vi and/or Vim come bundled with most minimal Linux distributions.
Vim Tutor is an in-built interactive tutorial that comes pre-packaged with Vim, designed to bring novices up to speed with the various modes and functions of this nimble tool. I had hopped into Vim Tutor before but never felt the need to complete it, as it seemed long and complex. Recently, my teacher and mentor Scott C. mentioned that this would be one of the first lessons we would undertake as part of the ProLUG system administration course. Being a dedicated student, I decided to give it my full attention — and I’m glad I did.
In previous attempts, I had reached the halfway point and felt confident I had gained enough information to edit files. Some functions are unintuitive at first, like using the hjkl keys for navigation instead of arrow keys. There are many jokes about the overload people feel when they first encounter Vim’s conventions. Jokes like never being able to exit the program or forgetting one’s own name after memorizing commands are common. Mastering Vim requires memorizing commands until they become second nature, which simply takes time. This is why I hadn’t completed Vim Tutor before — there’s only so much one can absorb before needing a break. However, this time, I was able to make it through to the end, pleasantly surprised by the new techniques I had learned.
Modes are what make Vim a powerful tool. There are three modes in Vim: Normal, Insert, and Visual.
Normal mode is the default mode, where you navigate a document using motions. It protects the document from accidental modifications and allows for a broader range of single-key commands.
Insert mode is where characters or strings are added — fairly self-explanatory.
Visual mode allows you to make selections, much like clicking and dragging with a mouse to highlight text.
Although I had known about these modes, it once seemed improbable that I would ever memorize them well enough to use them reflexively. However, with practice, I have done just that. Combining motions and commands can lead to huge efficiency gains. For example, you can navigate to a specific line, delete the first three letters, and paste something at the end of the line with just a few keystrokes.
What did I actually learn that I will immediately employ? Well, I now have a solid grasp of most single-key commands, so I’ll start stringing commands and motions together, such as deleting three words and appending text to the end of a line.
I also learned that Vim’s buffer, much like a clipboard, stores strings for later use — and deleted lines are stored there as well. I’ll be more mindful of using the buffer going forward.
Lastly, running shell commands from within Vim seemed inefficient to me before, since I could easily jump in and out of files. However, I now understand that it can speed things up.
Vim isn’t something you just pick up on a whim. It’s more like a martial art, where you practice movements until they become second nature. In a world dominated by graphical user interfaces, Vim can seem like a waste of time and effort. Yet, when you’re working under the hood of an operating system, especially on bare-bones UNIX servers, it becomes clear that if everything is a file and many configurations must be made, Vim is the right tool for the job.
I frequent a Discord group called ProLUG (Professional Linux User Group). The group is organized around cooperative, project-based learning, led by experienced members. One of these groups, called Coding Cove, is led by Ryan Long (SaltyCatfish). Ryan is a very experienced and senior developer who introduces us to new concepts on a weekly basis.
This past weekend, Ryan introduced Vue.js and the ideas behind the framework. We spent over an hour discussing and interacting with Vue, and I came away from the meeting excited to learn more and start building projects.
What I really liked about Vue is the concept of templates and components. These ideas seemed logical from the start. Templates can be created and reused on multiple pages, while components provide modularity. Together, these features result in a very clean and easy-to-read codebase, especially for larger projects.
Prior to learning about Vue, I had completed a few projects using HTML, Tailwind CSS, and React. While I’m a big fan of Go (for reasons I won’t get into here), I found React to be cumbersome. React often creates messy code, especially when combined with Tailwind.
After the meeting, I felt inspired to explore combining the power of Go with Vue. I started searching for examples, and it’s definitely doable for simple or small projects. However, when I looked at more advanced projects, the situation became complicated. Gluing a Go backend to a Vue frontend felt relatively simple at first, but when you introduce middleware, SSR/CSR, OAuth2, and more, things quickly become complex.
Nuxt is a “batteries-included” framework built on top of Vue. It comes with all the modern build tools and services needed for a professional project, and everything ties together elegantly.
I’ve done a deep dive into Nuxt, and it feels very comfortable to work with. After purchasing a course on Udemy, I’ve completed a few simple projects and intend to build a mid-level project soon. With Vue’s templating and components, along with Tailwind’s efficiency, I’m confident I can create a functional and aesthetically pleasing project that runs efficiently across different systems.
I am a member of a fantastic group called the Professional Linux User Group lead by Scott Champine. The home base is on Discord where over 2000 people discuss Linux daily.
Scott and other members teach via Live-Streaming and Interactive Labs with supporting documentation. Scott has created a 16 week deep dive course into linux adminstration starting September 14th that I have gladly enrolled in.
This course will take place every Saturday via a livestream with interactive Q/A wherein participants leave with assignments. This blog is in part, related to the course as I will document my learning among other things.